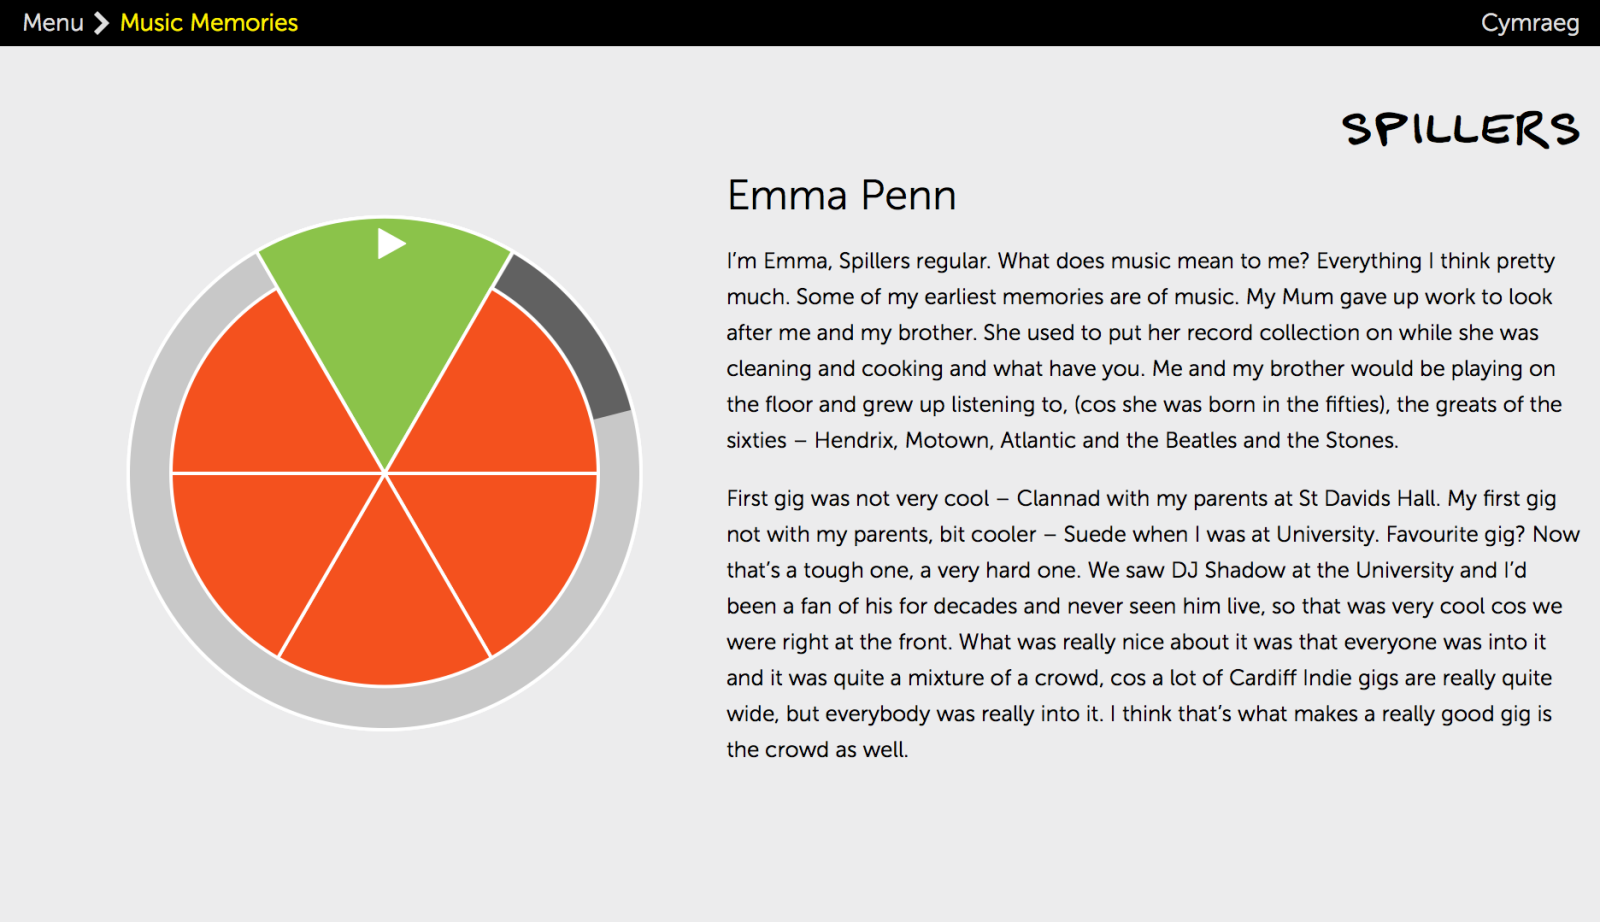
Museum Visitors and Their Fingers - Gallery Touchscreen Statistics (VADU part III)
, 28 June 2016
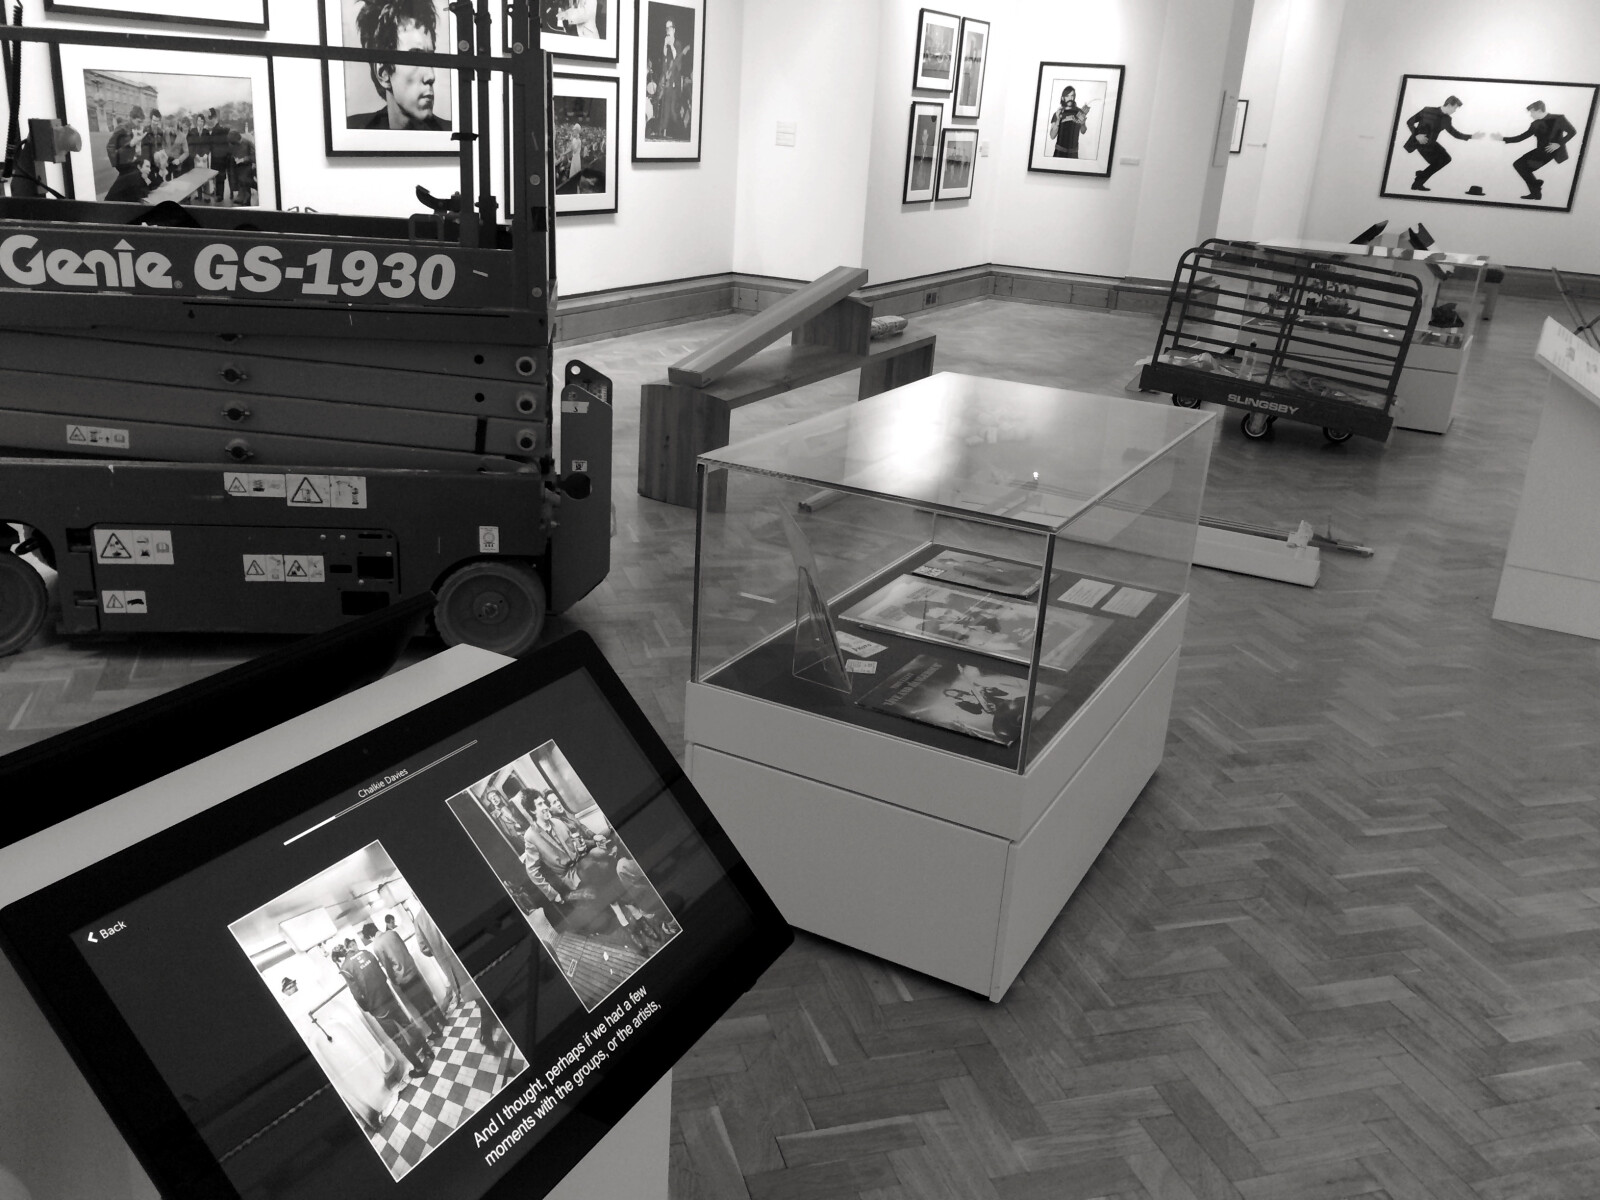
Visual Audio Display Units (VADUs) still exist in the National Museum Cardiff galleries. We know, because with almost every finger touch on the touchscreen, it sends a little signal to the web server that includes a piece of information describing the last interaction (i.e. ‘please play the video’, ‘please display the menu list’). We record all those messages, firstly to make sure the kiosk is actually working day-to-day and secondly to find out which aspects are popular or not popular, knowledge that is useful to guide future kiosk development.
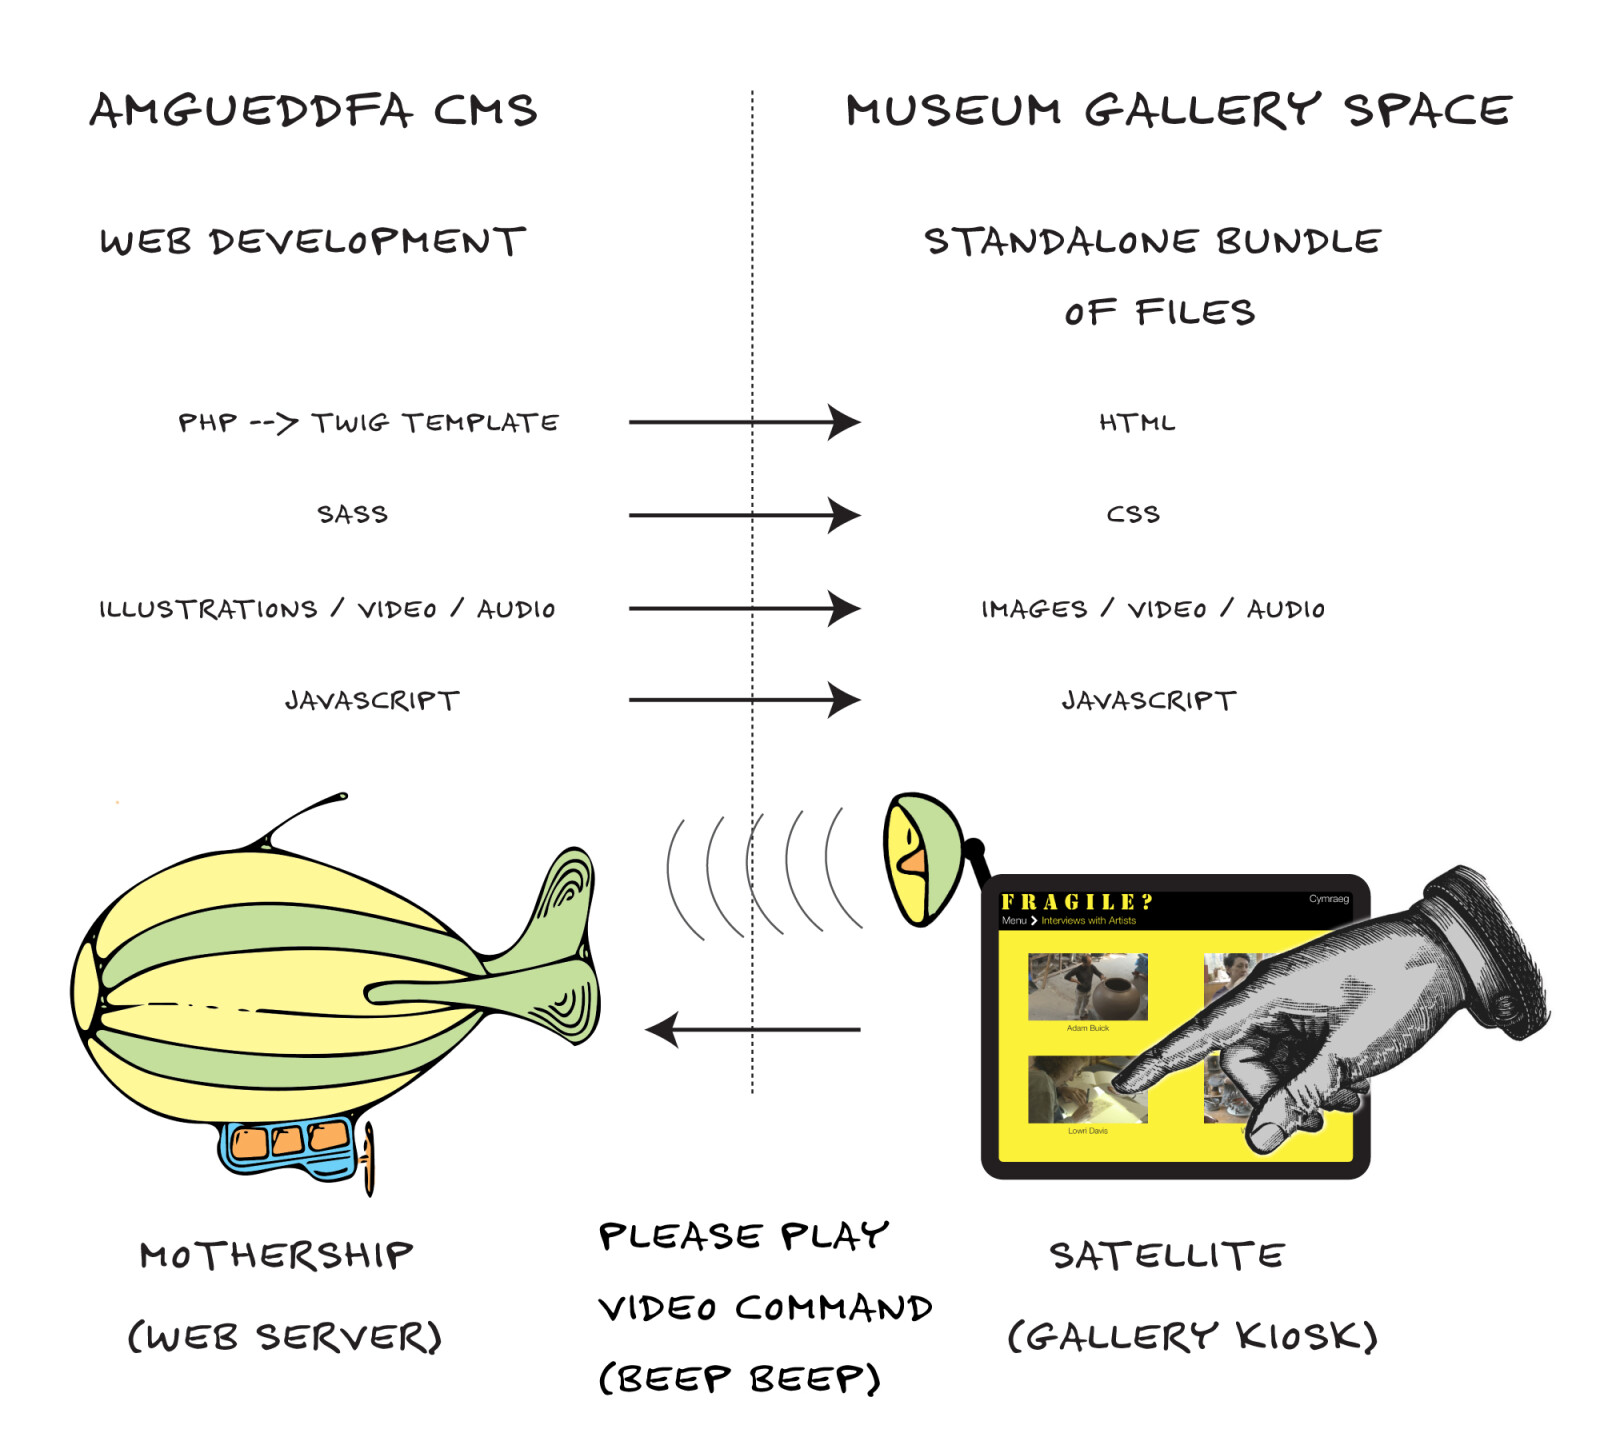
Figure 1, a cartoon of kiosk development process - an attempt to show the separation from the web server, while maintaining rudimental communication from the gallery space (satellite to mothership).
Each message is sent as an AJAX call (asynchronous JavaScript and XML) from the kiosk, which is usually a standalone bundle of files running through a web browser (HTML, CSS & Javascript files). The main bulk of the kiosk development is carried out through our in-house web CMS (called Amgueddfa CMS) on a computer that mirrors the public web server, it’s only before the launch that all the necessary files are copied over to the computer in the exhibition space (wrapped up as an ‘App’), where it remains like a satellite away from its mothership (the web server). Beep beep, beep beep.
Patterns of Frequency
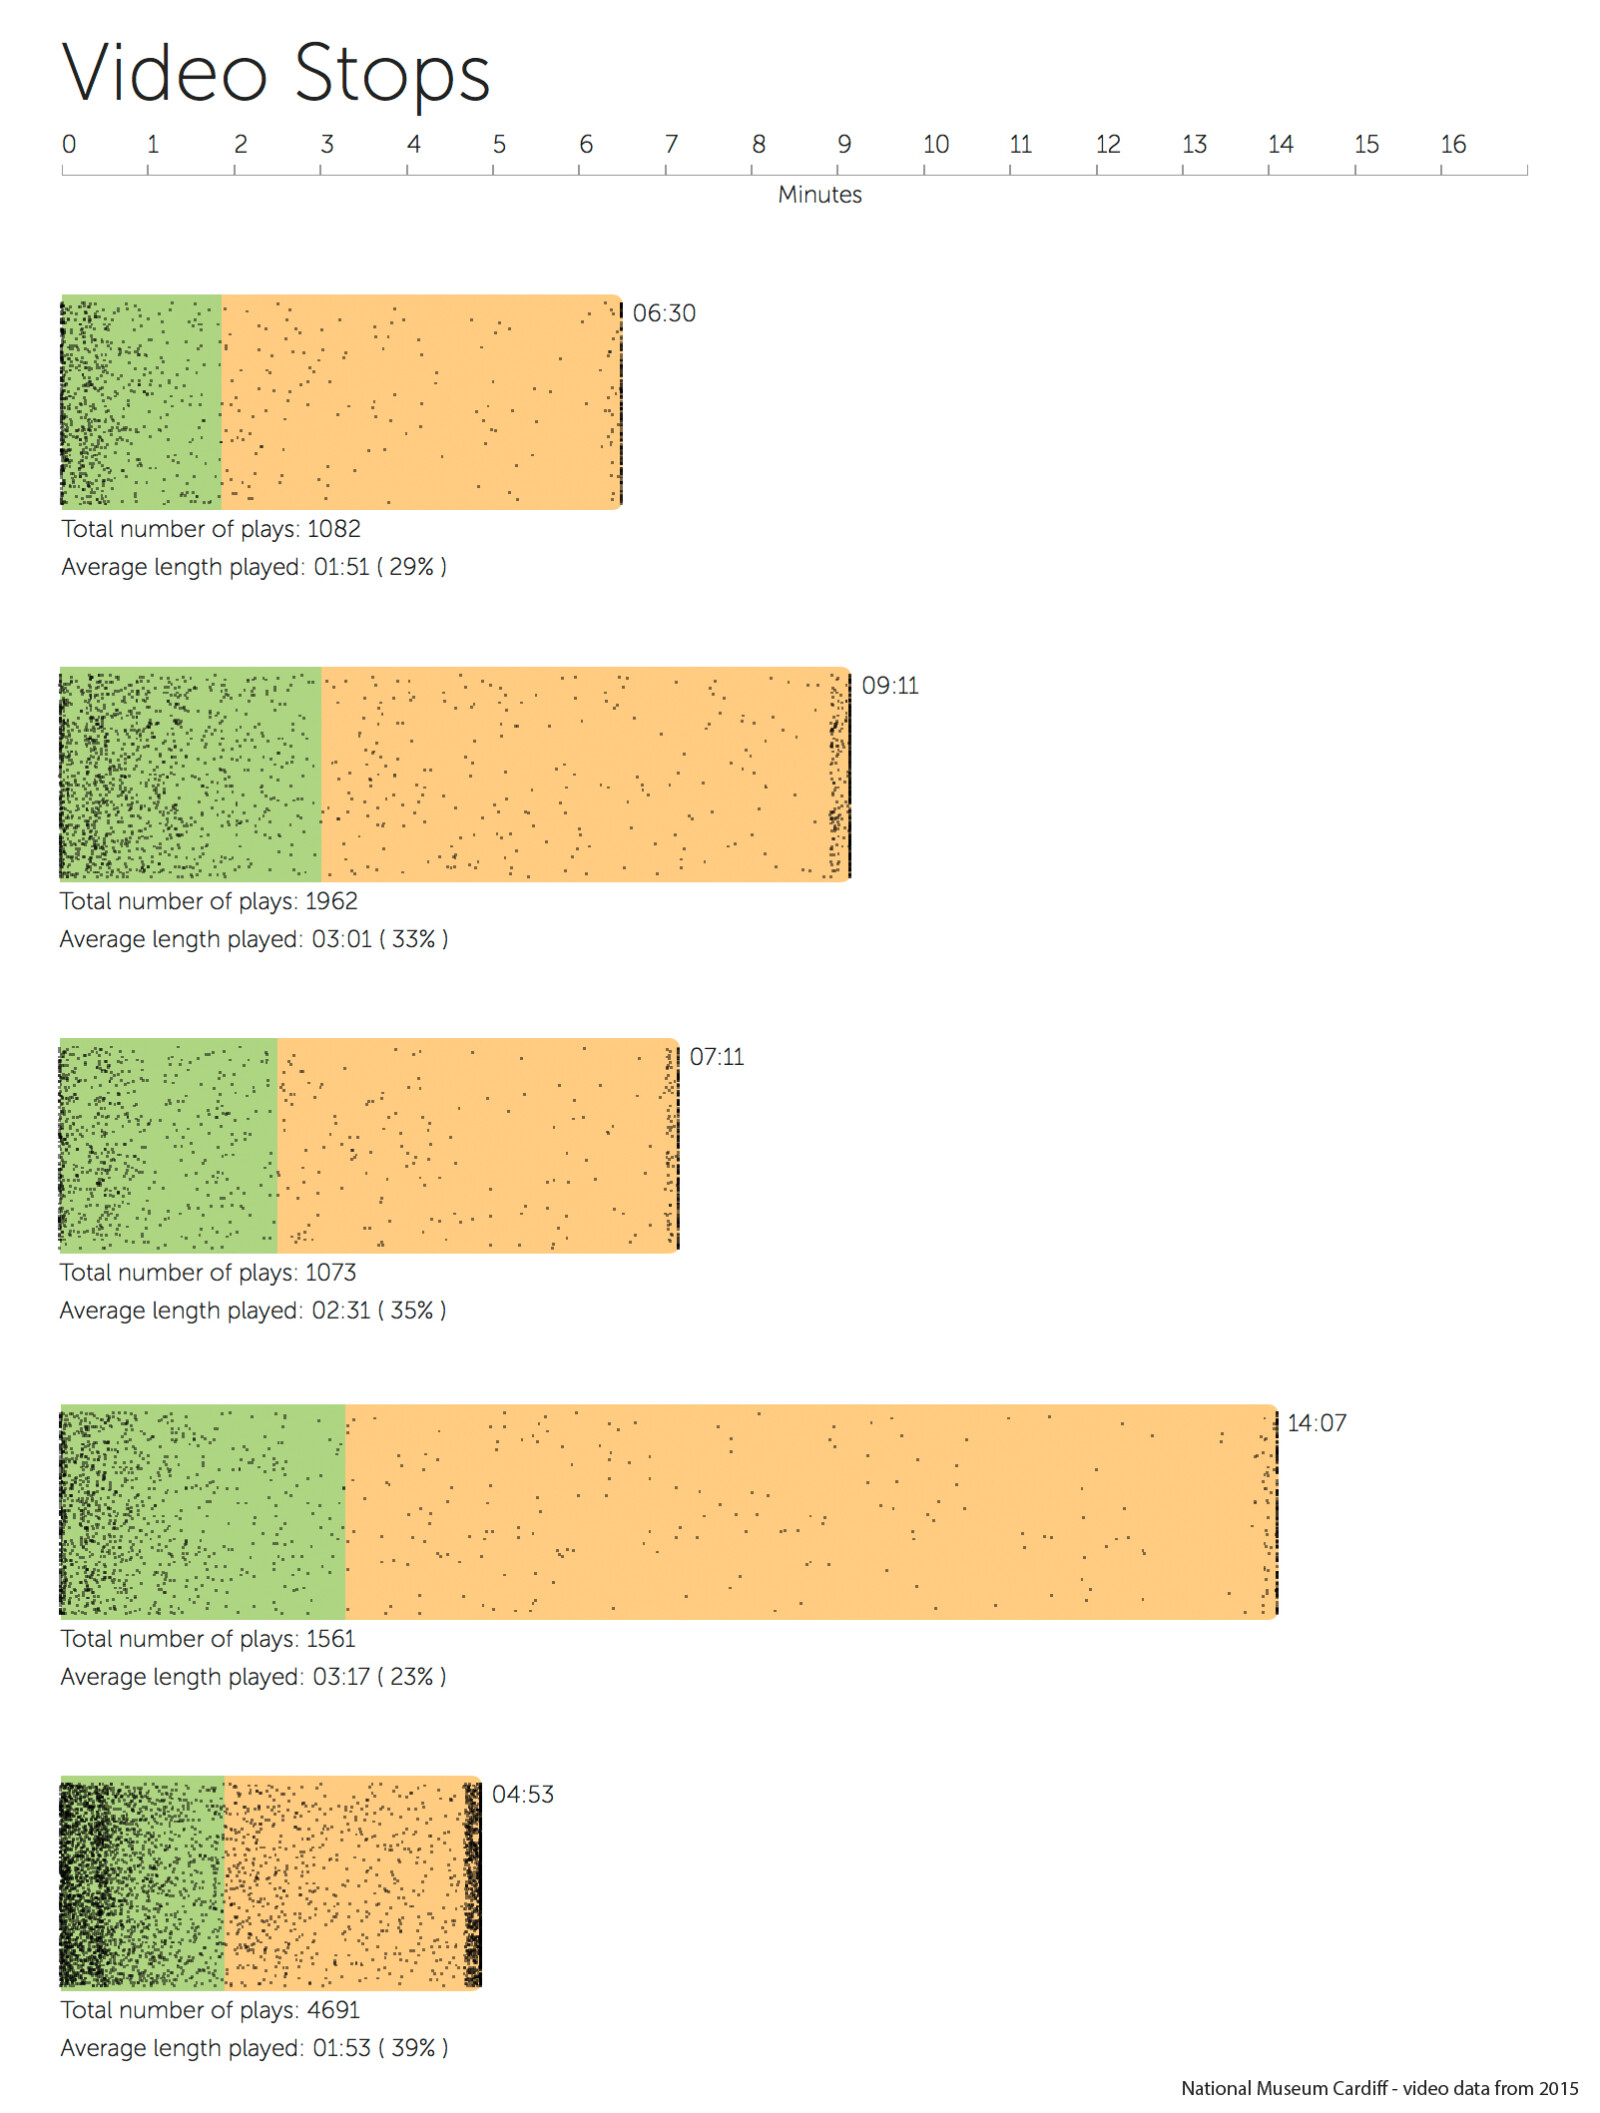
A single recorded kiosk command is not particularly exciting by itself but when there are greater numbers, patterns emerge. For instance, if we record each time a video is started on the kiosk we get a round number to how many people were interested in the subject matter of the video (information gathered before they had seen the video). If we also record when people stop playing the video we can start to distinguish patterns in their viewing behaviour. Judging by the average video length played the majority of the visitors saw less than 39% of the total video length, with the longest average being three minutes 17 seconds. Of course, there were also lots of visitors who watch the videos until the end; as you can tell by the 'happy-tail' patterns formed by visitors reaching the film credits at the end of the film (figure 2).
Figure 2 shows all video stop points for five videos presented as scatter plots against the video length in minutes. Judging by the average video length played, which is shown in green - the majority of the visitors saw less than 39% of the total video length, with the longest average being three minutes 17 seconds. Of course, the there were also lots of visitors who watch the videos until the end (as you can see by the 'happy-tail' patterns formed as they reach the film credits at the end of the video), but on the whole I wouldn't recommending placing feature length films on kiosks. 
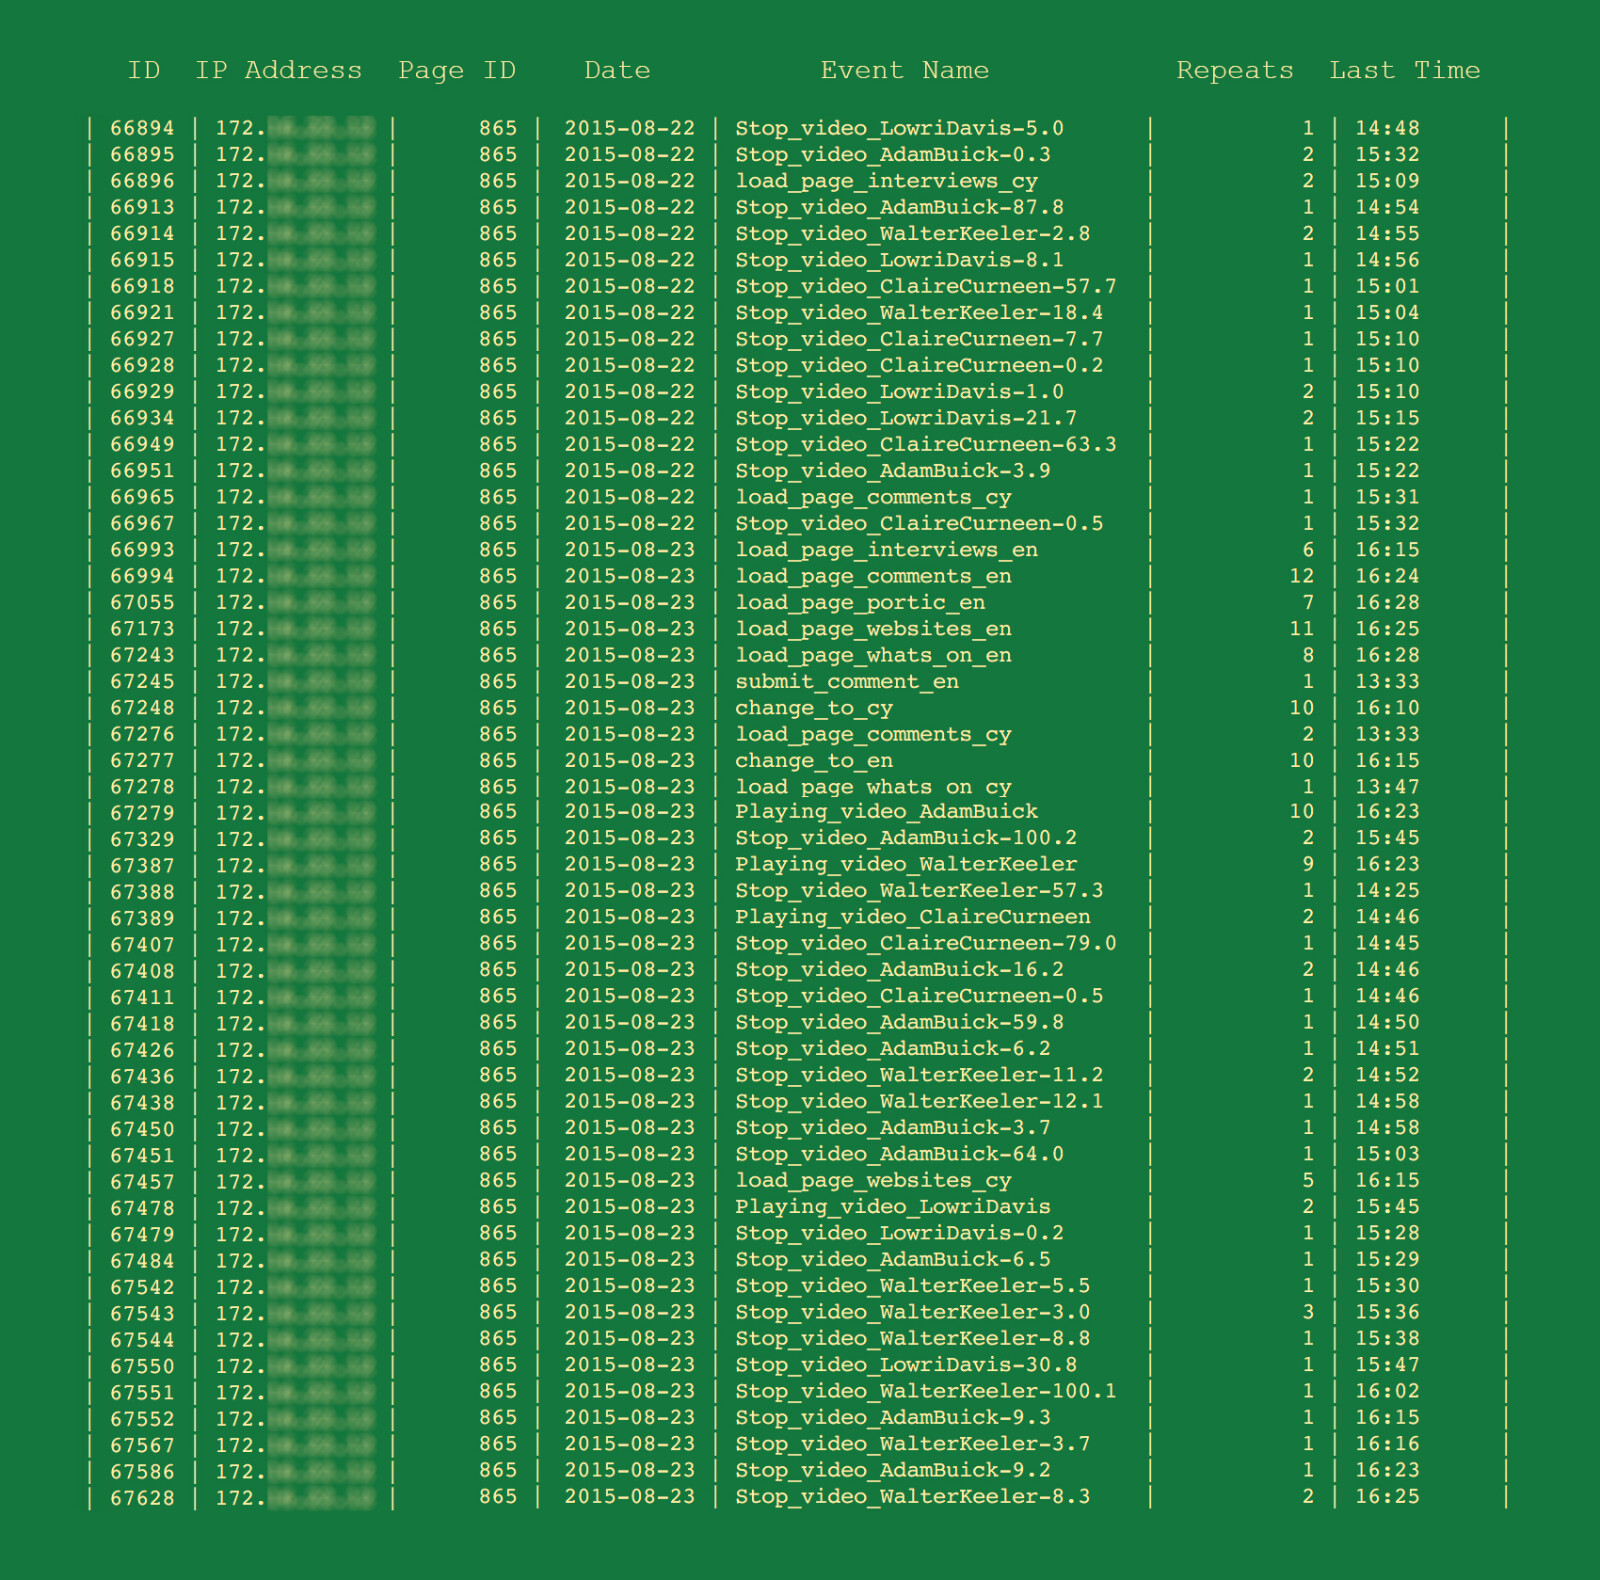
Figure 2 shows the raw data stored within a database table on the web server.
Overview of the Numbers
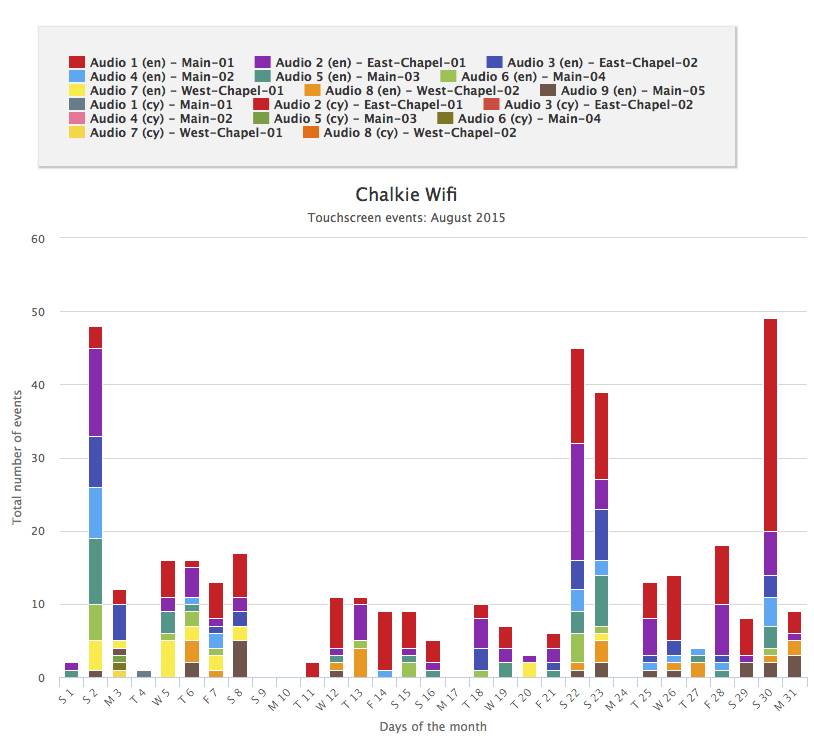
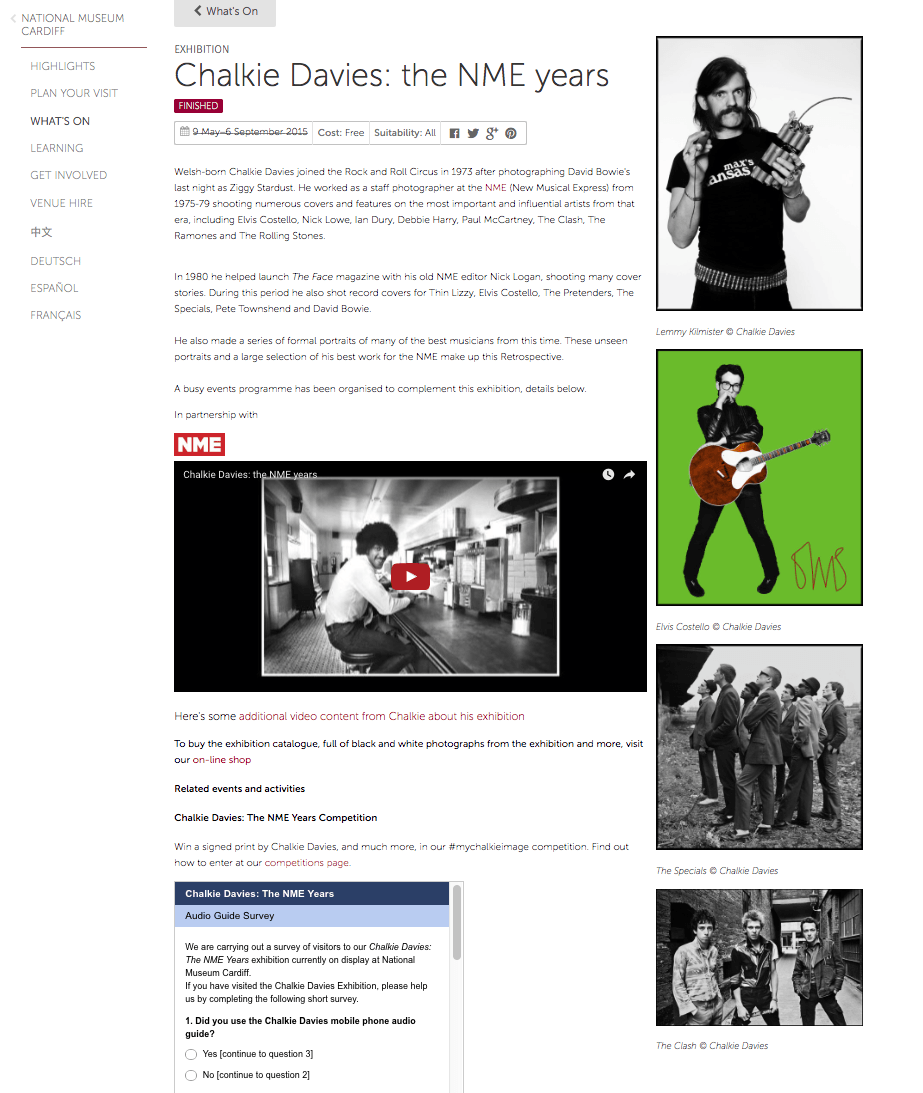
I signed-off my last blog with a promise of data relating to the Wi-Fi audio tour during the Chalkie Davies exhibition last year, which I’m including below. To placing the Wi-Fi statistics within the gallery space, I’ve also gathered data from the four large screen kiosks in the exhibition against the monthly visitor figures.
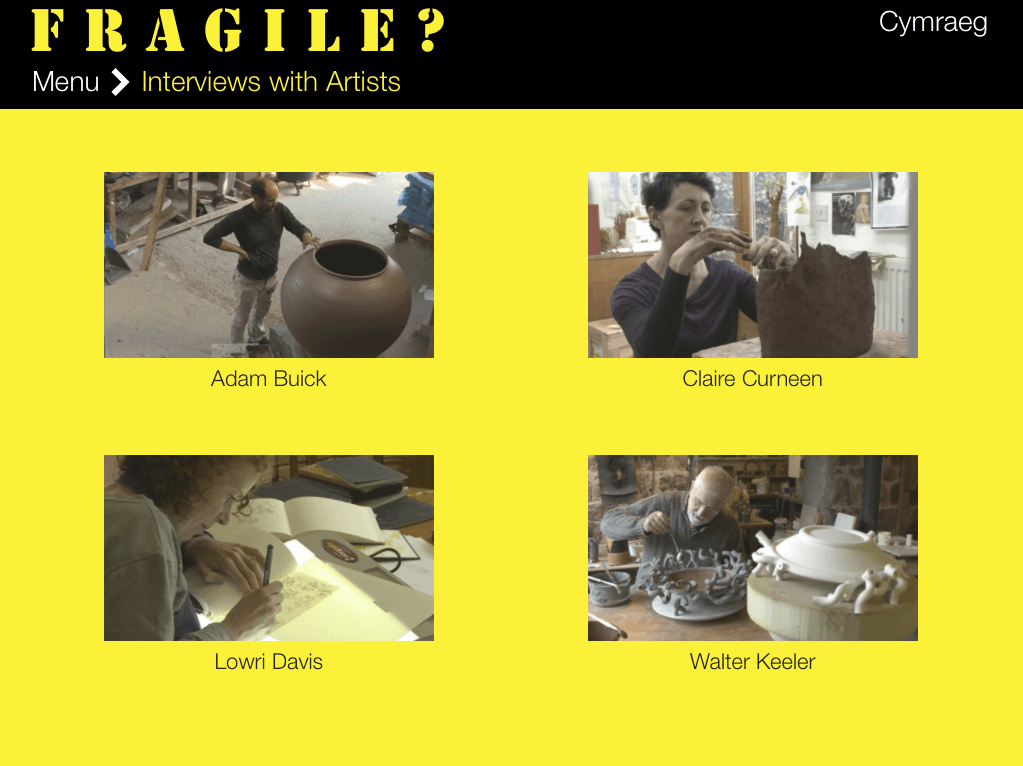
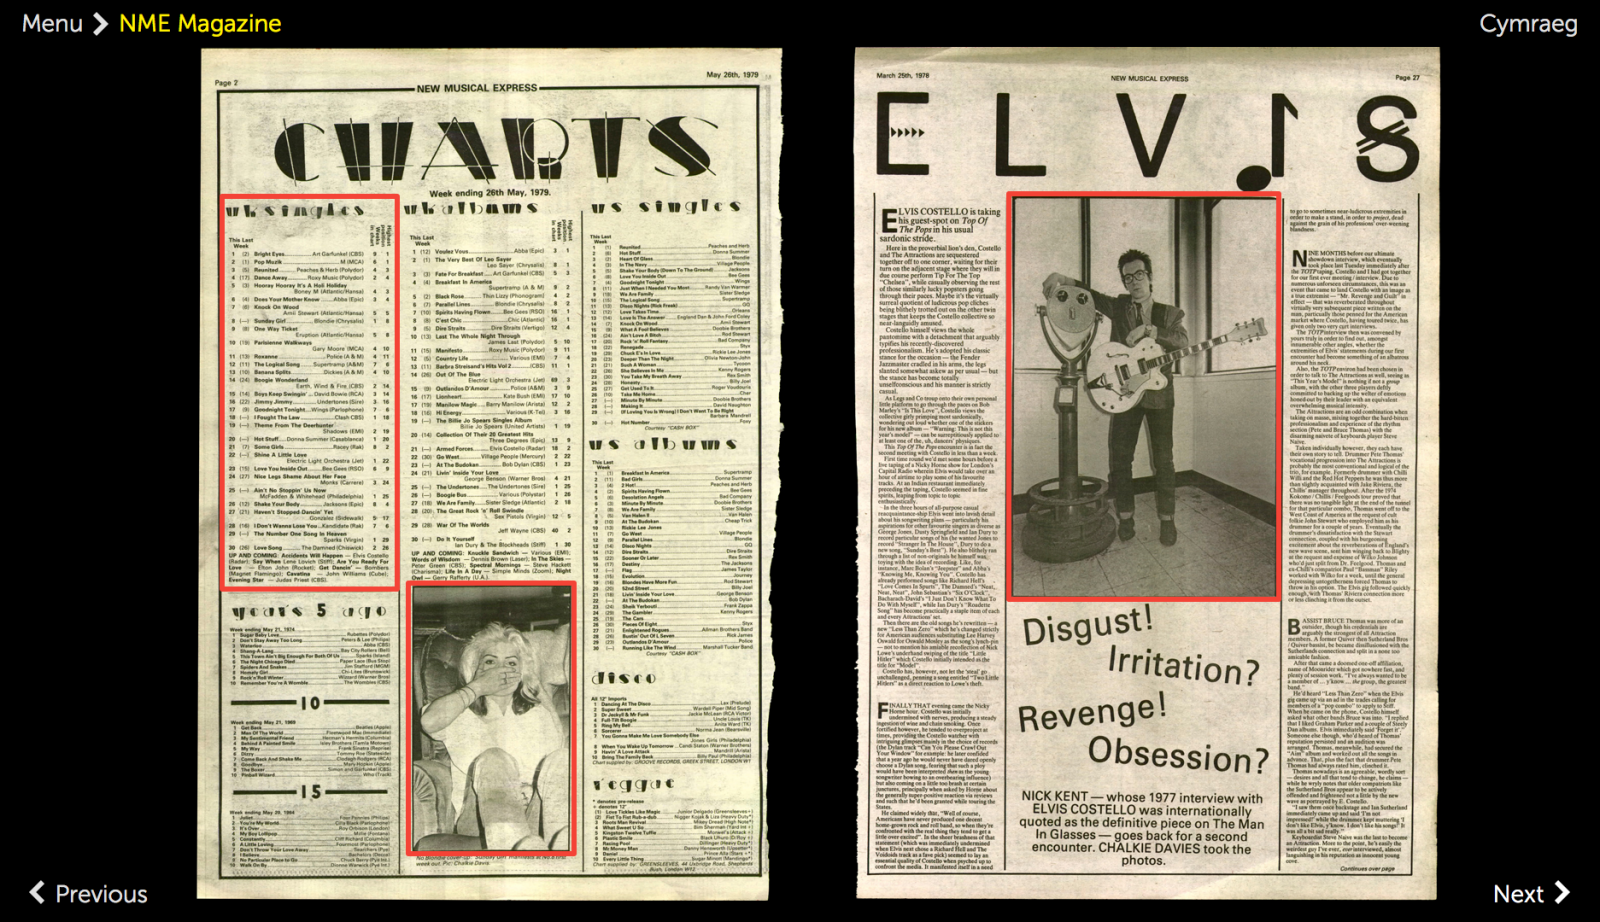
It is immediately clear that the four large kiosks were very popular - they contained a great deal of curated content which included a composite NME magazine, Chalkie Davies film, Youth Forum audio interviews, a comments section and What’s On calendar. I can imagine the relative attraction and easy access of the kiosks goes a long way to explain the comparatively lower figures of the Wi-Fi audio tour, but let us not be downbeat - the feedback received from the visitor survey about the Wi-Fi was positive.
- 93% of survey monkey results either felt they ‘learnt a lot about the exhibition’ or ‘it improved their experience as a visitor’ - it must be noted that the number of people who filled in the survey and used the Wi-Fi audio tour was extremely low compared to the overall gallery visitor figures (12 / 42,000), but the survey morsel is still very positive.
However, I would be cautious in suggesting an Wi-Fi audio tour for short-run exhibitions, mainly due to the diminished numbers compared to the insitu kiosks - the Wi-Fi audio tour could gain popularity following a less exhibition-specific avenue (e.g. providing audio descriptions for the top ten popular objects), which would allow the audio catalog to be built gradually and remain available all year around throughout the museum.
Future Beeps
To conclude, we have been collecting kiosk statistics since 2011. The storage method may change, we could additionally store the data on Google servers via Google Analytics, but however the beeps are stored the way visitor interact with museum kiosks will continue to guide the future kiosk development.
Table showing all the touchscreen events for the Chalkie Davies exhibition with visitor figures for the gallery:
|
Large touch screen x 4 |
|||||||
|
Language |
7 May 2015 |
June 2015 |
July 2015 |
Aug 2015 |
7 Sept 2015 |
||
|
Video (film plays) |
1717 |
1085 |
1735 |
2833 |
352 |
7722 |
|
|
Chalkie Interview |
EN |
1280 |
1044 |
1362 |
1953 |
338 |
5977 |
|
Chalkie Interview |
CY |
124 |
123 |
164 |
237 |
38 |
686 |
|
NME magazine |
EN |
1209 |
961 |
1205 |
1841 |
355 |
5571 |
|
NME magazine |
CY |
60 |
56 |
72 |
148 |
17 |
353 |
|
NME Next Page |
1974 |
2119 |
2099 |
2324 |
530 |
9046 |
|
|
NME Previous Page |
1303 |
1025 |
1098 |
1666 |
463 |
5555 |
|
|
NME Zoom Photograph |
985 |
681 |
909 |
1317 |
430 |
4322 |
|
|
Music Memories |
EN |
1409 |
1076 |
1464 |
2311 |
378 |
6638 |
|
Music Memories |
CY |
71 |
60 |
95 |
138 |
17 |
381 |
|
Music Audio (track plays) |
1766 |
1583 |
1806 |
2410 |
486 |
8051 |
|
|
Comments |
EN |
881 |
702 |
840 |
1383 |
230 |
4036 |
|
Comments |
CY |
71 |
54 |
78 |
105 |
11 |
319 |
|
Comments submitted |
124 |
131 |
168 |
260 |
30 |
713 |
|
|
What's On |
EN |
783 |
684 |
847 |
1335 |
241 |
3890 |
|
What's On |
CY |
55 |
50 |
63 |
126 |
12 |
306 |
|
Totals |
12509 |
10409 |
12907 |
18721 |
3465 |
63,566 |
|
|
Wi-Fi Audio Tour |
Using their own mobile devices |
||||||
|
Language |
7 May 2015 |
June 2015 |
July 2015 |
Aug 2015 |
7 Sept 2015 |
||
|
Audio (plays) |
EN |
316 |
212 |
262 |
394 |
124 |
1308 |
|
Audio (plays) |
CY |
10 |
3 |
4 |
4 |
1 |
22 |
|
Totals |
326 |
215 |
266 |
398 |
125 |
1,330 |
|
|
Number Gallery Visitors |
7 May 2015 |
June 2015 |
July 2015 |
Aug 2015 |
7 Sept 2015 |
||
|
Totals |
9108 |
7107 |
10688 |
14130 |
1961 |
42,994 |
|