Spring Bulbs for Schools Investigation Results 2021-22
, 1 July 2022
Hi Bulb Buddies,
I’ve had an interesting time compiling the end of year report for the Spring Bulbs for Schools Investigation. I’ve attached the reports on the right for you but let’s take a quick look at some of the highlights!
Remember that our weather readings are taken between November and March, meaning that records for each year include readings from the November and December of the previous year. For example, when the report talks about results for 2012 it’s referring to data taken from November 2011 to March 2012.
2022 saw slightly higher than average temperatures and the second warmest February of our investigation. The MET Office has stated that February 2022 was the fifth warmest on record based on measurements dating back to 1919.
The graph shows that 2022 was the fourth warmest period of our study.
2022 saw the lowest and highest average hours of sunshine of our investigation. The MET Office has stated that 2022 saw the dullest December since 1956! It also saw the sunniest January and second sunniest March based on records dating back to 1919.
2022 saw the second highest hours of sunshine of our investigation. There are 25 hours difference between the year that saw the highest average hours of sunshine (2012) and the year that saw the lowest (2016).
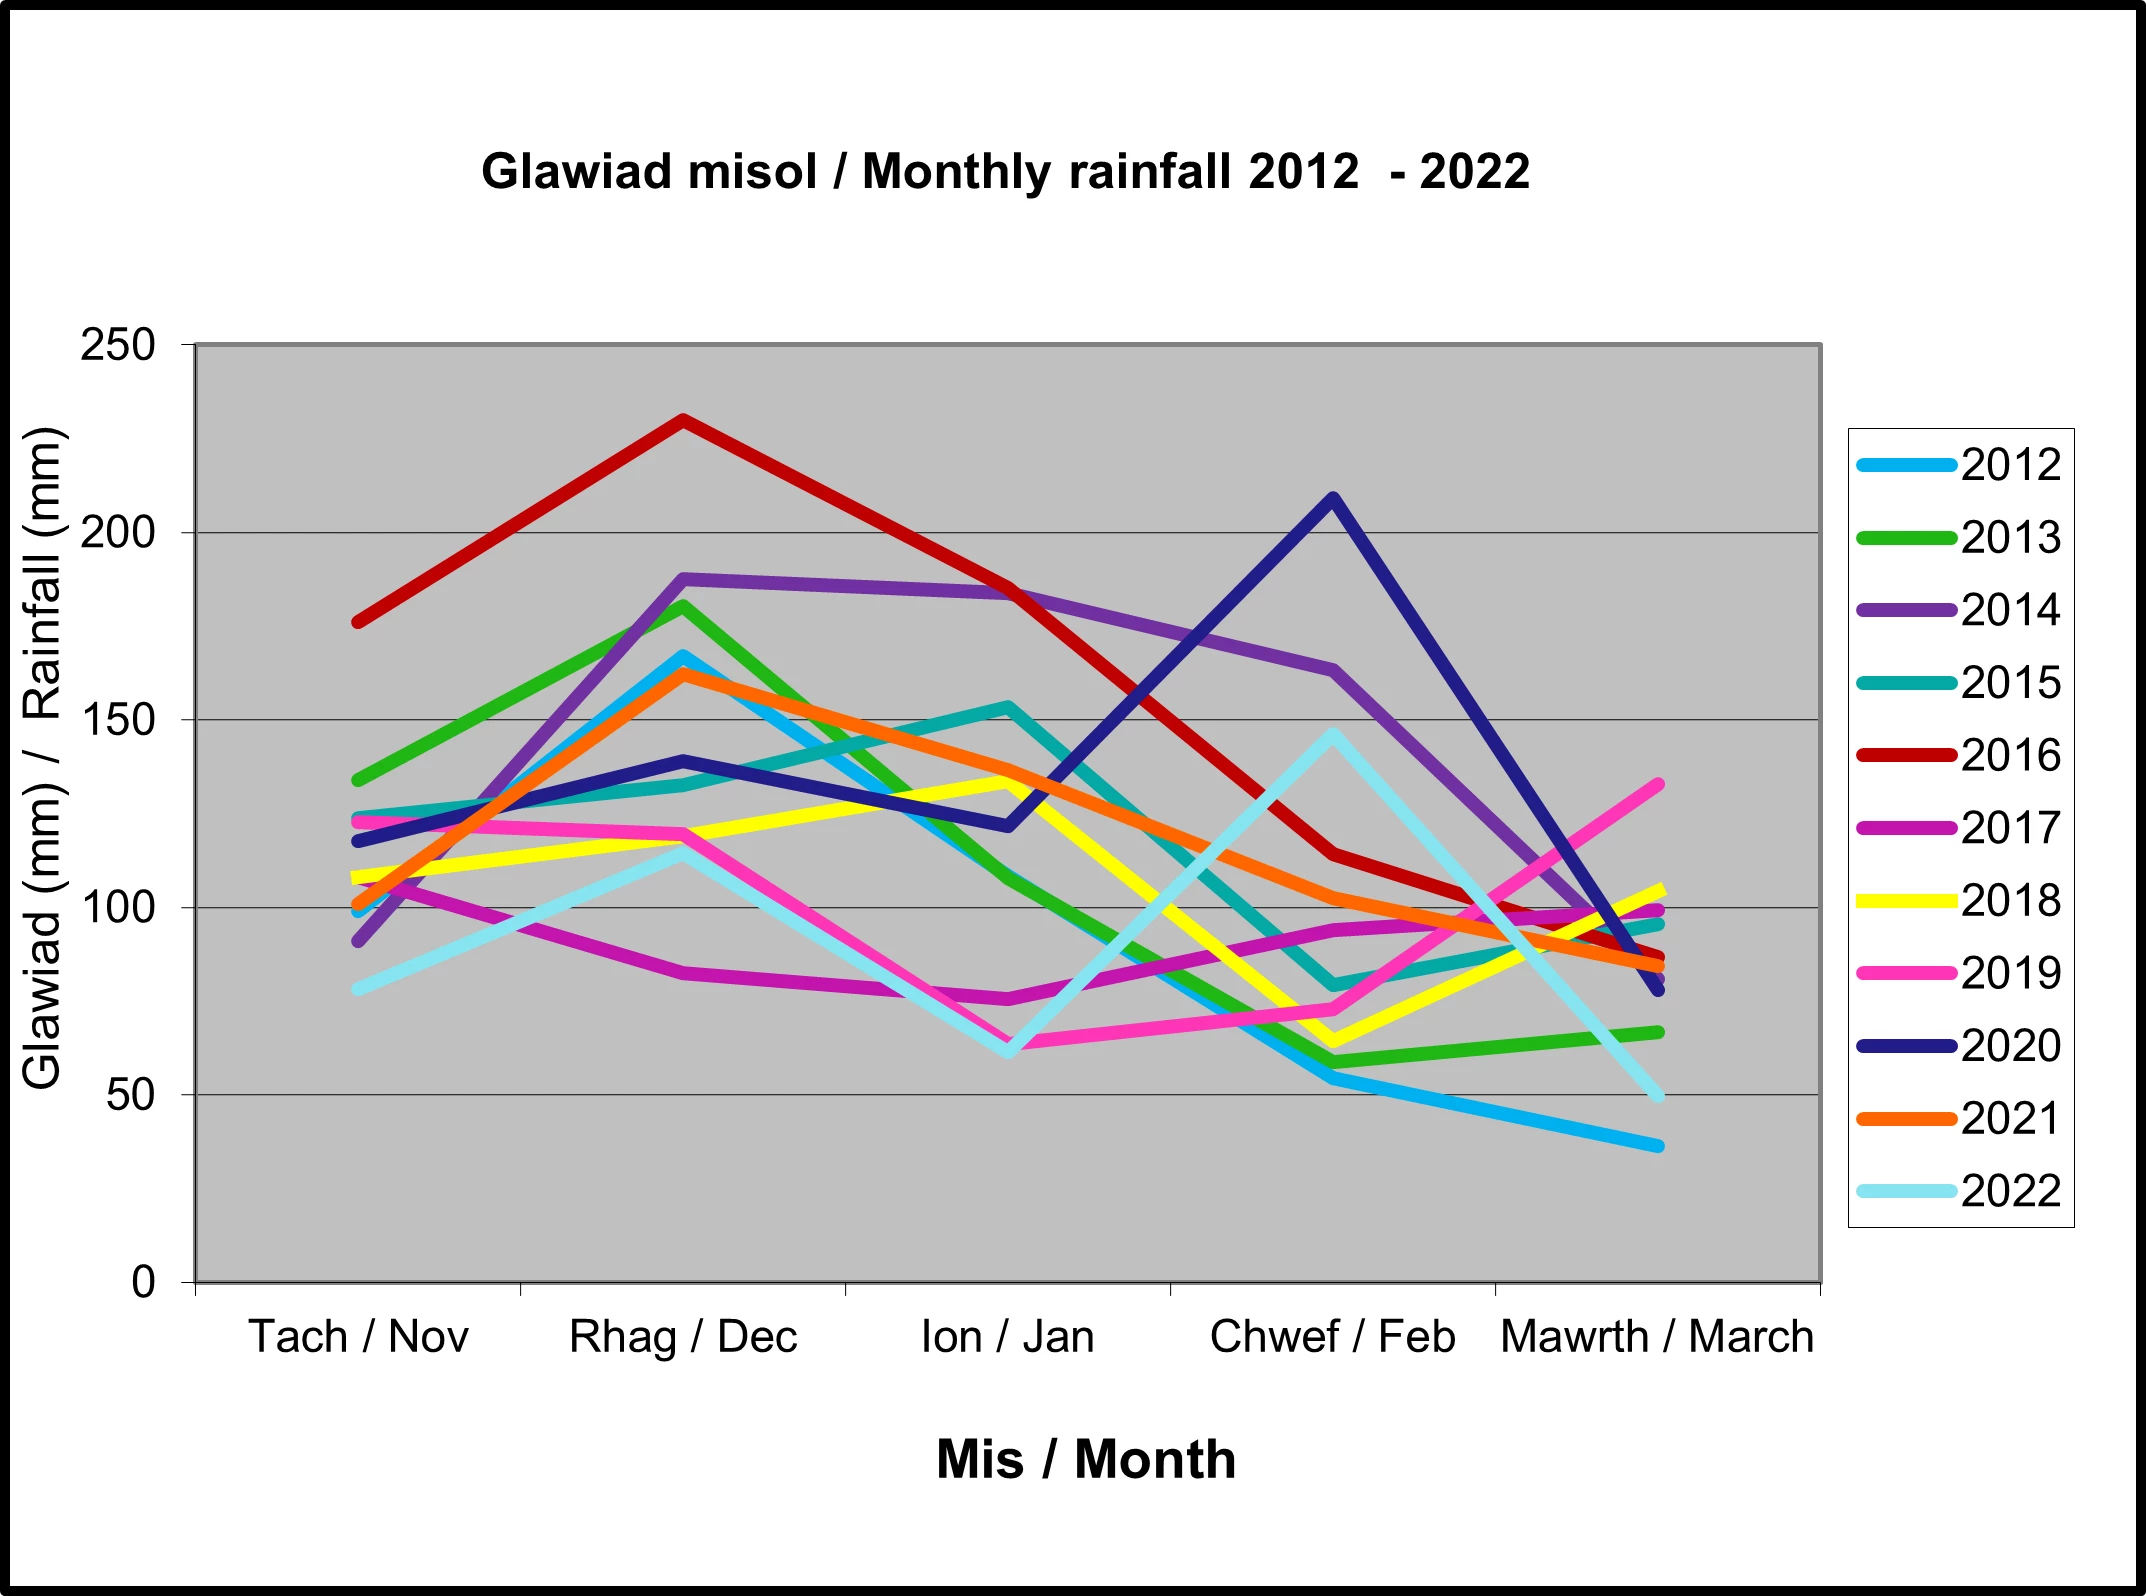
We can see from the chart that 2022 saw the lowest average rainfall of our investigation for November and January and the second lowest for March. In contrast, it saw the third highest rainfall for February. The MET Office has stated that February 2020 was the wettest on record with measurements dating back to 1862!
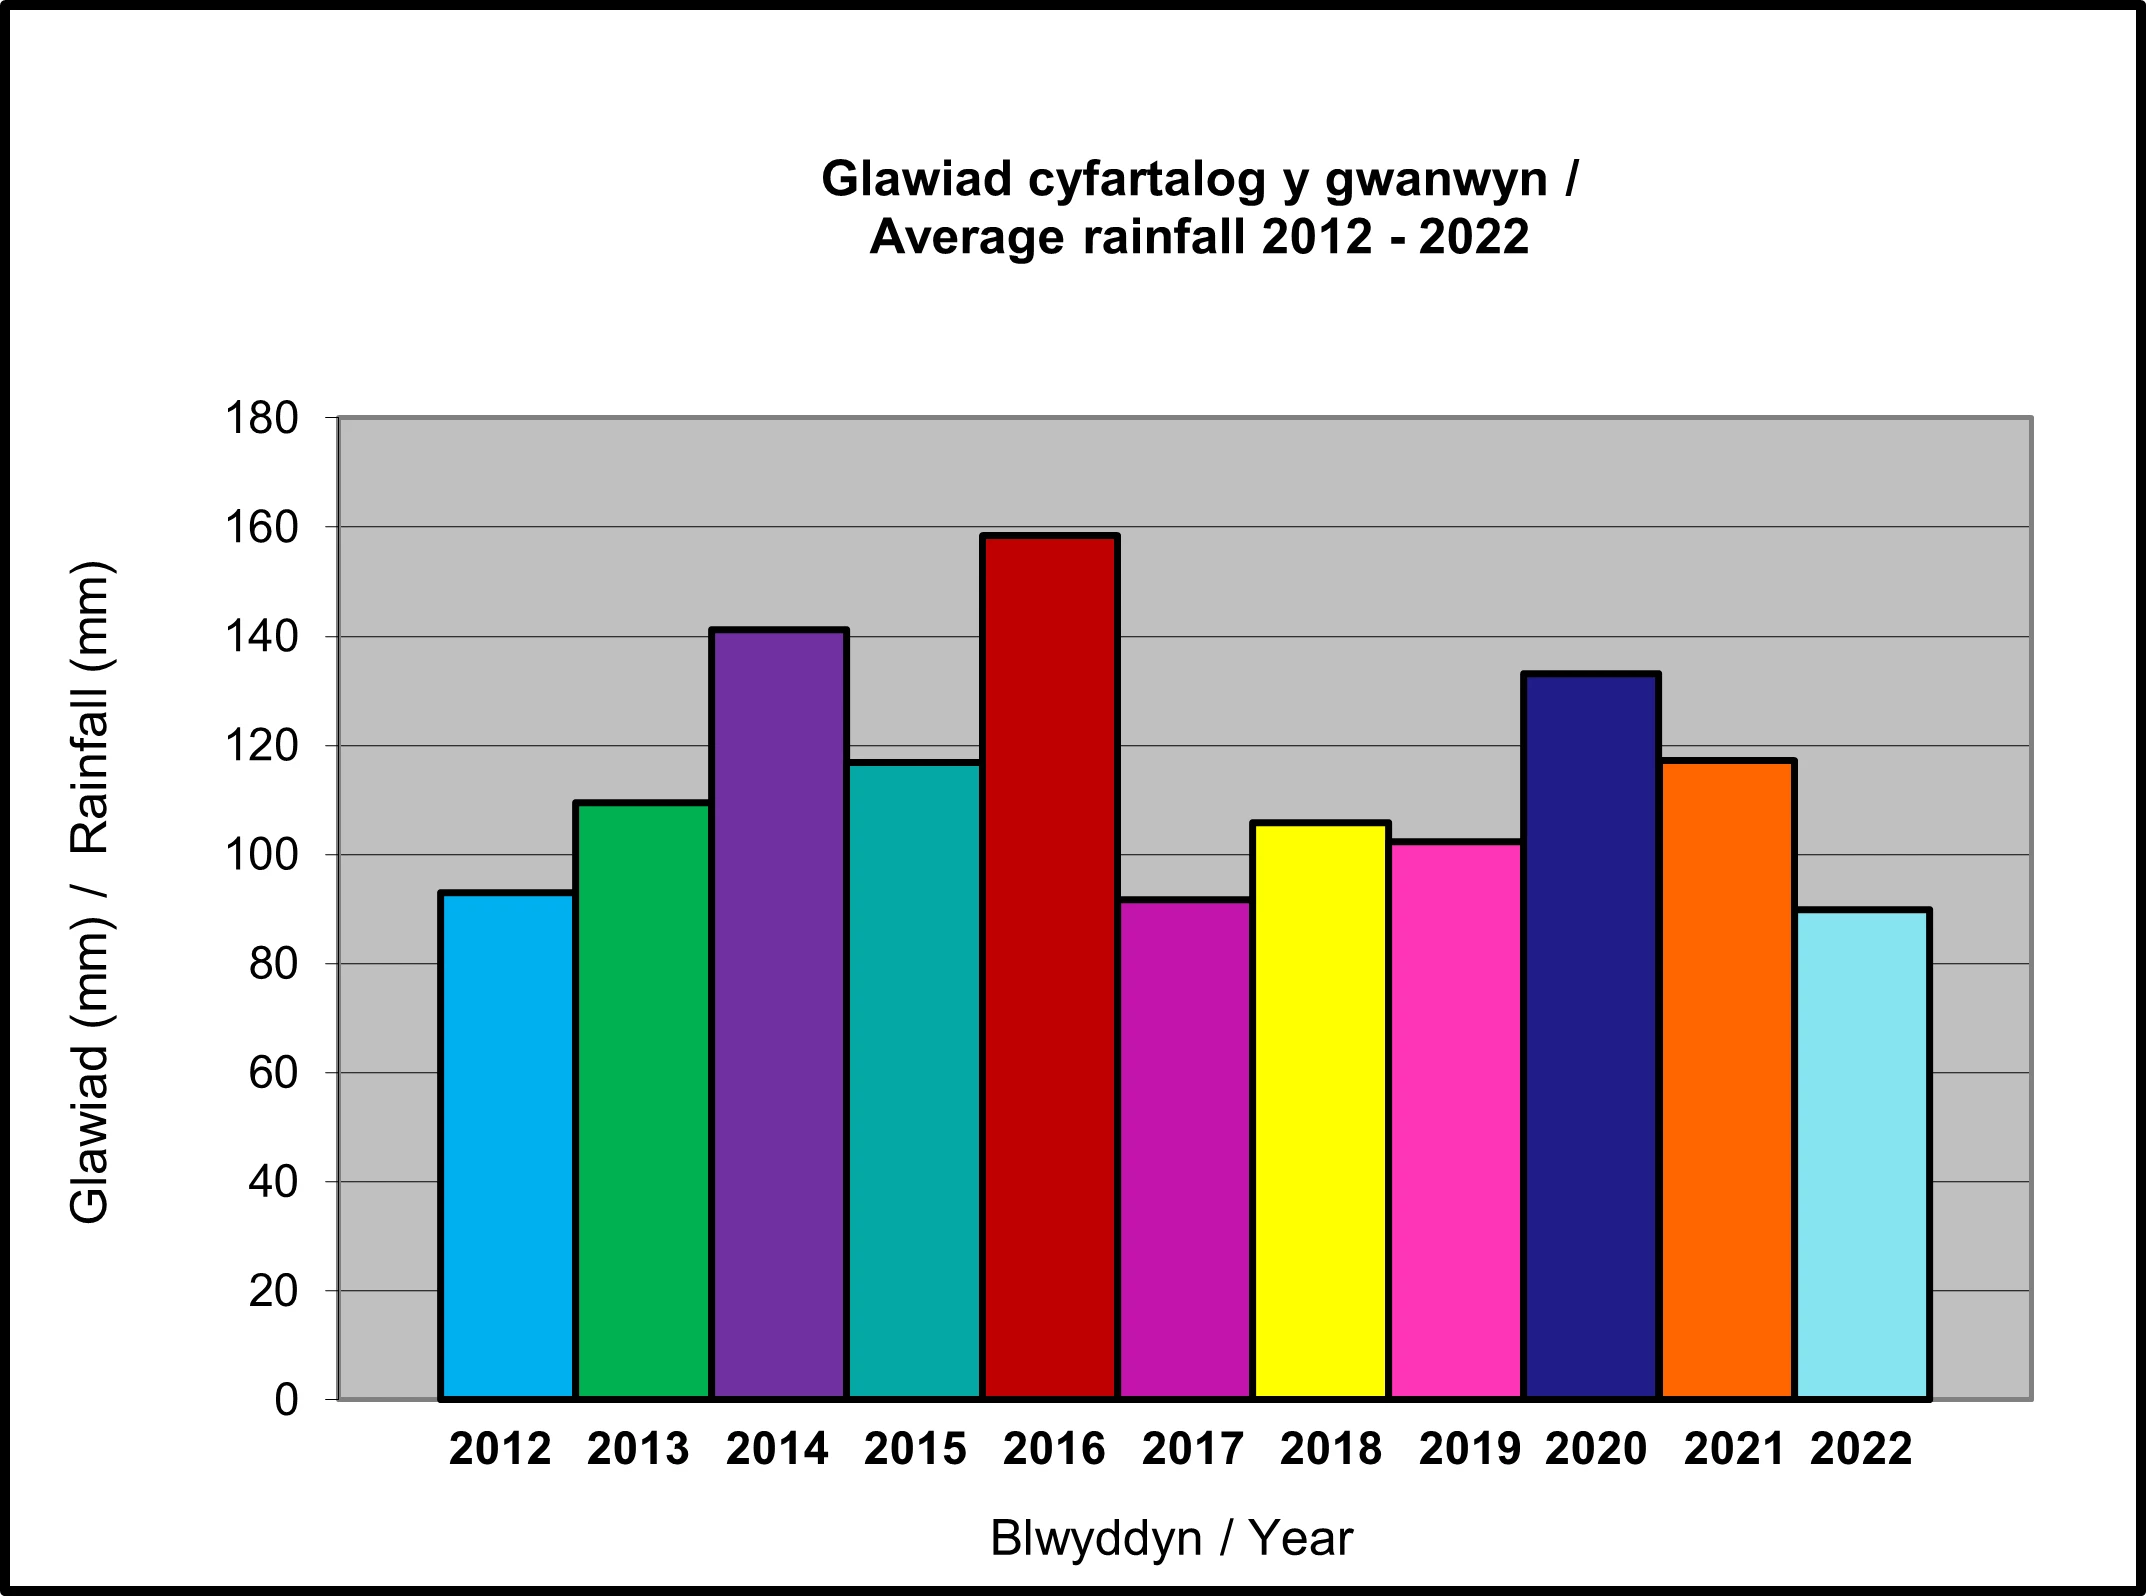
The bar chart shows that 2022 saw the lowest average rainfall of our investigation at 90mm while 2016 was the wettest year of the project with an average rainfall of 158mm.
Our results show that plants flowered earliest in Wales and latest in Scotland. Scotland was the coldest country and saw the least sun.
2022 saw both plants flower earlier than the overall average. It’s interesting to compare results from 2022 with the overall averages for the project. The table shows that 2022 saw above average temperatures and hours of sunshine and below average rainfall when compared to previous years.
The graph shows average hours of sunshine for the period November-March for Wales. We can see from the chart that Wales saw lower than average hours of sunlight for the period November 2001 to March 2022. It’s interesting to note that the years 2006 to 2012 all saw higher than average hours of sunshine and that since then only one year (2015) has seen above average hours of sunshine.
The difference between averages for Wales and averages for the UK highlights the regional variations that can occur. The MET Office have recently announced interesting regional variations in their latest climate reports. Climate is measured in 30-year periods, in line with guidelines from the World Meteorological Organisation. A comparison between the 1961-1990 and 1991-2020 periods has revealed an increase in temperature (+0.8°C), rainfall (+2.3%) and sunshine (+5.6%) for the UK.
It will be interesting to see what patterns will emerge from our results as our long term study continues. Thank you for your contribution to this year’s investigation and I hope that you will follow the progress of the 2022-23 investigation from September.
Great work Bulb Buddies,
Professor Plant


