: Spring Bulbs

What is fog?

Penny Dacey, 8 February 2023

The MET Office have issued weather warnings for fog for large parts of the UK today. Fog is dangerous when travelling because it causes poor visibility. Have you walked in a thick fog before? I’ve walked into a fog where I could only see about a foot to either side of me. It was thrilling, but I was on a long, even, mostly empty beach at the time. I wouldn’t have liked to be crossing roads or surrounded by obstacles I couldn’t see. 

Fog is made of water droplets smaller than rain drops. Some parts of the world use nets designed to capture the water droplets of fog, which provides a supply of water in areas that don’t see much rain. Some places call this ‘sky fishing’ or ‘stealing from the sky’. How much water do you think can be collected from fog? The MET Office website states that ‘if you were to fill an Olympic sized swimming pool with fog and then somehow condense it, you would be left with around 1.25 litres of water (or just over 2 pints).’ 

Do you know the difference between mist and fog? It’s visibility! The Met Office states that ‘If you can see more than 1,000 metres it's called mist, but if it is thicker and the visibility drops below 1,000 metres it's called fog.’ Mist and fog are both formed from water droplets collecting in the air, but mist is less dense (meaning an Olympic sized pool full of mist would provide less water when condensed) this means it can be seen through easier and is less likely to stick around for a long time. 

Fog can also be described as a cloud forming at ground level. This is because fog and clouds form in the same way. They are the result of warm, moist air being cooled. Water vapour in the air cools to form water droplets. For example, think about how the water vapour from a hot shower, clings to the cool glass of a mirror as condensation. Or, how on a cold day your breath forms a mist when you exhale, as your warm breath mixes with the cold air. Clouds form when warm, moist air meets with cooler air flows. Fog often forms when warm, moist air is cooled by cold surfaces. For this reason, fog is more common in autumn and winter when the ground is coldest. Except for coastal fog, which is more common when warm, moist summer air meets the cold surface of the sea. 

Water droplets in fog cause poor visibility by reflecting light, which can distort shapes and make it difficult to judge distances. The MET Office refers to thick fog when visibility is below 180m and dense fog when it’s below 50m (that’s the length of the Olympic sized pool we’ve been talking about!). It’s interesting to note that thicker fogs often form in industrial areas. This is because water droplets cling to tiny particles in the air. At the coast the water usually attaches to salt particles in the air. In industrial areas it’s often particles of air pollution that the water collects around. This means that industrial areas (which are usually the areas of highest air pollution) are more likely to see thicker fogs, because there are more particles in the air for the water to cling to. 

Fog that mixes with air pollution is often called smog (smoke fog). Smog can turn the sky green, yellow, red, brown, black or grey. It’s been a problem since the onset of the Industrial Revolution in the late 1700’s, which saw an increase in coal burning for industry (for example to fuel factories and steam trains). In December 1952 London saw what become known as ‘The Great Smog’, during which weather conditions trapped the smoke from coal fires and produced ideal conditions for the formation of a dense fog. Combined, this caused poor air quality that was extremely dangerous. The Clean Air Acts of 1956 and 1968 were a direct result of this, reducing emissions of black smoke. As a result, fewer smogs were reported in the UK in the following decades. 

However, since then something known as Photochemical smog (or summer fog) has become more common, especially in largely populated industrial cities with warm climates. This forms when sunlight reacts with pollution particles in the air (nitrogen oxides from car exhausts or coal burning and volatile organic compounds from gasoline, cleaning products and household aerosols). Photochemical smog is bad for our health and damaging to crops and plants. It forms without smoke or fog and is only named the same (smog) because the resulting haze is similar. 

So, what can we do? Well, raising awareness by talking to others about what you learn is key. That's why I'm writing this blog and telling you!  We can also think about how we can reduce chemicals in the atmosphere. We might choose to walk, cycle or get the bus rather than travel by car. We might choose natural household cleaners and detergents over chemical ones. It can be as simple as choosing a roll-on deodorant over a spray (aerosol) one. By talking about what we learn we can encourage others to sign petitions that raise awareness of issues like air quality and  to vote for politicians who show by their voting record that they take issues relating to climate seriously. There are lots of things that can be done, gaining an understanding of the problems and their causes is the first step. 

Let’s look at the weather observations sent in by schools this week. I wonder if anyone has mentioned the fog!


School comments:

Stanford in the Vale Primary School: It’s been a windy week and we have finally got to see two digit numbers with the temperatures finally. We can see spring is just around the corner with buds on the trees and snowdrops around the school grounds. We are checking our bulbs every day at the moment. 

Livingston Village Primary School: We noticed that all the bulbs have started to grow which are the daffodils. Last year’s daffodils have started growing too.

Irvinestown Primary School: We had snow this week!

Logan Primary School: We have some little green shoots in our plantpots

Sacred Heart Primary School – Omagh: Our bulbs are shooting in both the pots and the ground

St Mary's Primary School (Newry): Still no sight of flowers but the shoots are up for the leaves. 

Gavinburn Primary School: After all the rain last week the has been none at all this week and it has felt really cold.

Roseacre Primary Academy: WE can't wait for the flowers.

St Anne's Catholic Primary School – Knowsley: Other days not recorded as ground frozen and path slippery

Fleet Wood Lane Primary School: We are starting to take pictures of the bulbs because we can see the start of the daffodil flowers.

Weather Warnings

Penny Dacey, 25 January 2023

Hello bulb buddies,

What an interesting time to be studying and observing the weather! Most of you will have had frost and cold winds this last week. I've heard that many schools have had to close in January because of the effects of extreme weather conditions, such as ice and floods.  Even on days where schools were open, conditions in the school grounds may have meant you weren’t able to collect weather data.

It’s likely that you’ve heard people talking about weather warnings a lot recently. Weather warnings are released by the MET Office (the UK’s official weather service) and are colour coded (green, yellow, amber and red) to indicate how extreme the weather will be in different areas.

Green: weather is not expected to be extreme.

Yellow: possibility of extreme weather so you should be aware of it.

Amber (orange): strong chance of the weather effecting you in some way, so be prepared.

Red: extreme weather expected, plan ahead and follow the advice of the emergency services and local authorities.

The Met Office also use symbols to indicate what type of weather to expect. For example, the symbols to the right show (in order) a red warning for rain, green for wind, green for snow, amber for ice and green for fog. This means there will be heavy rain and that you should prepare for ice. Why not have a look at the Met Office website and see what the weather forecast is for where you live?

The Met Office warn us about bad weather so that we can prepare for it. This is because extreme weather (such as strong winds and ice) can cause difficulties and make it hard to travel. Roads and train lines can close, flights can be cancelled, and walking conditions can be dangerous.

What was the weather like where you live? If you weren’t able to collect weather records you can enter ‘no record’ on the online form, but please let me know in the comment section what the weather was like! You can also let me know how your plants are doing and whether they have begun to sprout!

Keep up the good work Bulb Buddies,

Professor Plant
Weather Records 2022

Penny Dacey, 4 November 2022

Hi Bulb Buddies, 


hope that planting day went well and that you are enjoying documenting weather data for our investigation. 

I want to say a big thank you to you all for your hard work on planting day. Together we planted over 18 thousand bulbs across the UK! Your fantastic planting day photos show that you had a great time.  


Weather records started on 1 November. There is a resource on the website with more information on keeping weather records. I’ve attached this here in case you haven’t already seen it. This resource helps you to answer important questions, such as why rainfall and temperature readings are important to our investigation into the effects of climate on the flowering dates of spring bulbs.  


Use your Weather Chart to log the rainfall and temperature every day that you are in school. At the end of each week, log into your Spring Bulbs account on the Amgueddfa Cymru – National Museum Wales website to enter your weekly readings. You can also leave comments or ask questions for me to answer in my next Blog. 


Let me know how you get on and remember that you can share photos via email or Twitter. 


Keep up the good work Bulb Buddies, 


Professor Plant 

Planting Day 2022

Penny Dacey, 20 October 2022

Hello Bulb Buddies,


Schools from across the UK will be planting their bulbs as close to 20 October as they can. 


Click here for activities and resources that will help you with this part of the project and with looking after your bulbs over the coming months. 


These resources will help you on planting day:

  • Adopt your Bulb (an overview of the care your bulbs will need)

  • Planting your Bulbs (guidelines for ensuring a fair experiment)


And these activities are fun to complete:

  • Bulb Adoption Certificate

  • Make Bulb Labels


Please read the resources as they contain important information. For example, do you know to label your pot so that you know which side the daffodil and crocus are planted?


Remember to take photos of your planting day to enter the Planting Day Competition. Do this by sharing your images on Twitter or via email. 


Keep an eye on Professor Plant's Twitter page to see how planting day goes for other schools.


Best of luck Bulb Buddies, let us know how you get on.


Professor Plant & Baby Bulb

Spring Bulbs for Schools Investigation Results 2021-22

Penny Dacey, 1 July 2022

Hi Bulb Buddies,

I’ve had an interesting time compiling the end of year report for the Spring Bulbs for Schools Investigation. I’ve attached the reports on the right for you but let’s take a quick look at some of the highlights!

Remember that our weather readings are taken between November and March, meaning that records for each year include readings from the November and December of the previous year. For example, when the report talks about results for 2012 it’s referring to data taken from November 2011 to March 2012.

2022 saw slightly higher than average temperatures and the second warmest February of our investigation. The MET Office has stated that February 2022 was the fifth warmest on record based on measurements dating back to 1919.


The graph shows that 2022 was the fourth warmest period of our study.

2022 saw the lowest and highest average hours of sunshine of our investigation. The MET Office has stated that 2022 saw the dullest December since 1956! It also saw the sunniest January and second sunniest March based on records dating back to 1919.


2022 saw the second highest hours of sunshine of our investigation. There are 25 hours difference between the year that saw the highest average hours of sunshine (2012) and the year that saw the lowest (2016).


We can see from the chart that 2022 saw the lowest average rainfall of our investigation for November and January and the second lowest for March. In contrast, it saw the third highest rainfall for February. The MET Office has stated that February 2020 was the wettest on record with measurements dating back to 1862!

The bar chart shows that 2022 saw the lowest average rainfall of our investigation at 90mm while 2016 was the wettest year of the project with an average rainfall of 158mm.

Our results show that plants flowered earliest in Wales and latest in Scotland. Scotland was the coldest country and saw the least sun.


2022 saw both plants flower earlier than the overall average. It’s interesting to compare results from 2022 with the overall averages for the project. The table shows that 2022 saw above average temperatures and hours of sunshine and below average rainfall when compared to previous years.


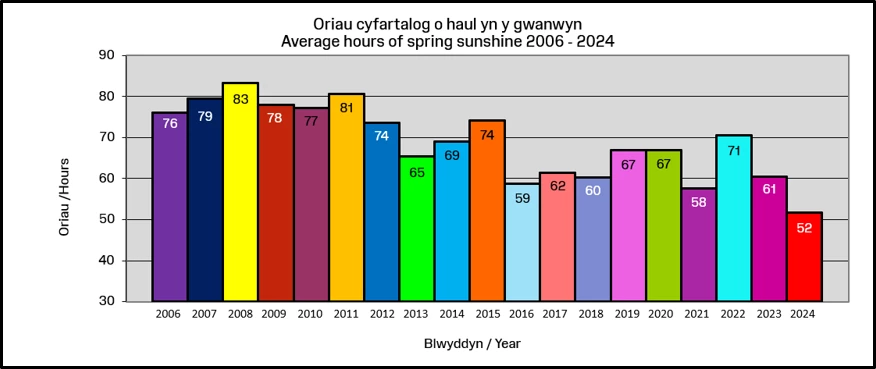
The graph shows average hours of sunshine for the period November-March for Wales. We can see from the chart that Wales saw lower than average hours of sunlight for the period November 2001 to March 2022. It’s interesting to note that the years 2006 to 2012 all saw higher than average hours of sunshine and that since then only one year (2015) has seen above average hours of sunshine.

The difference between averages for Wales and averages for the UK highlights the regional variations that can occur. The MET Office have recently announced interesting regional variations in their latest climate reports. Climate is measured in 30-year periods, in line with guidelines from the World Meteorological Organisation. A comparison between the 1961-1990 and 1991-2020 periods has revealed an increase in temperature (+0.8°C), rainfall (+2.3%) and sunshine (+5.6%) for the UK.

It will be interesting to see what patterns will emerge from our results as our long term study continues. Thank you for your contribution to this year’s investigation and I hope that you will follow the progress of the 2022-23 investigation from September.

Great work Bulb Buddies,

Professor Plant