exciting developments afoot...

Graham Davies, 26 February 2014

After much discussion and background work, the digital team at Amguefdda Cymru today began on the exciting path of redesigning its website.

As well as being timely (it’s been almost 5 years since our last design iteration *gasp*), there are a number of important factors driving this project, including an ambitious digital strategy to help deliver the

redevelopment of St. Fagans National History Museum

, as well as a comprehensive review of our institutional structure as a result of the Museums Change Programme.

Areas for development in this project will include providing greater access to online collections, increasing digital participation and also integrating today's social networking activities to encourage participation and sharing.

With these drivers in mind, we’ve been busy beavering away in the background over the last few months, researching audiences, analysing metrics, workshoping stakeholders and talking to our users. Why? Quite simply, we want this project to be as ‘evidence led’ as possible - let’s act on what our users tell us, from how they get to our website, to what they do when they get there.

time to put the user at the centre

From all this background research, we have developed a specific list of objectives that our new redesigned website will seek to provide. In summary these are;

  • Reflect first and foremost, the needs and interests of our users
  • Be focused on individual museum sites and our knowledge, not our corporate brand
  • Remove barriers to our information, including language and structure
  • Present a clear and logical navigational structure
  • Remove redundant sections and pages
  • Present a simple, clean design
  • Ensure that there are no dead ends for users - always offer an alternative if no exact content matches their search
  • provide fresh and routinely updated material

We are now in a position to take stock of our whole online offer: microsites, domains, social media connections, visiting pages, collections pages, even our in-gallery interfaces, while at the same time rethinking our traditional ‘institutional’ view of what we present online.

Most of you in Museum digital circles will know just how easy it is for websites to evolve through a reflection of internal structures. This is our chance to turn that thinking around and apply fresh perspectives, new ideas and modern technology to a website that really works for those visiting our websites - all based on evidence driven research, of course...

Timescale for all this? 8 months, so check back for updates to how this journey unfolds…

Museum records largest earthquake in UK since 2008!

Andrew Haycock, 25 February 2014

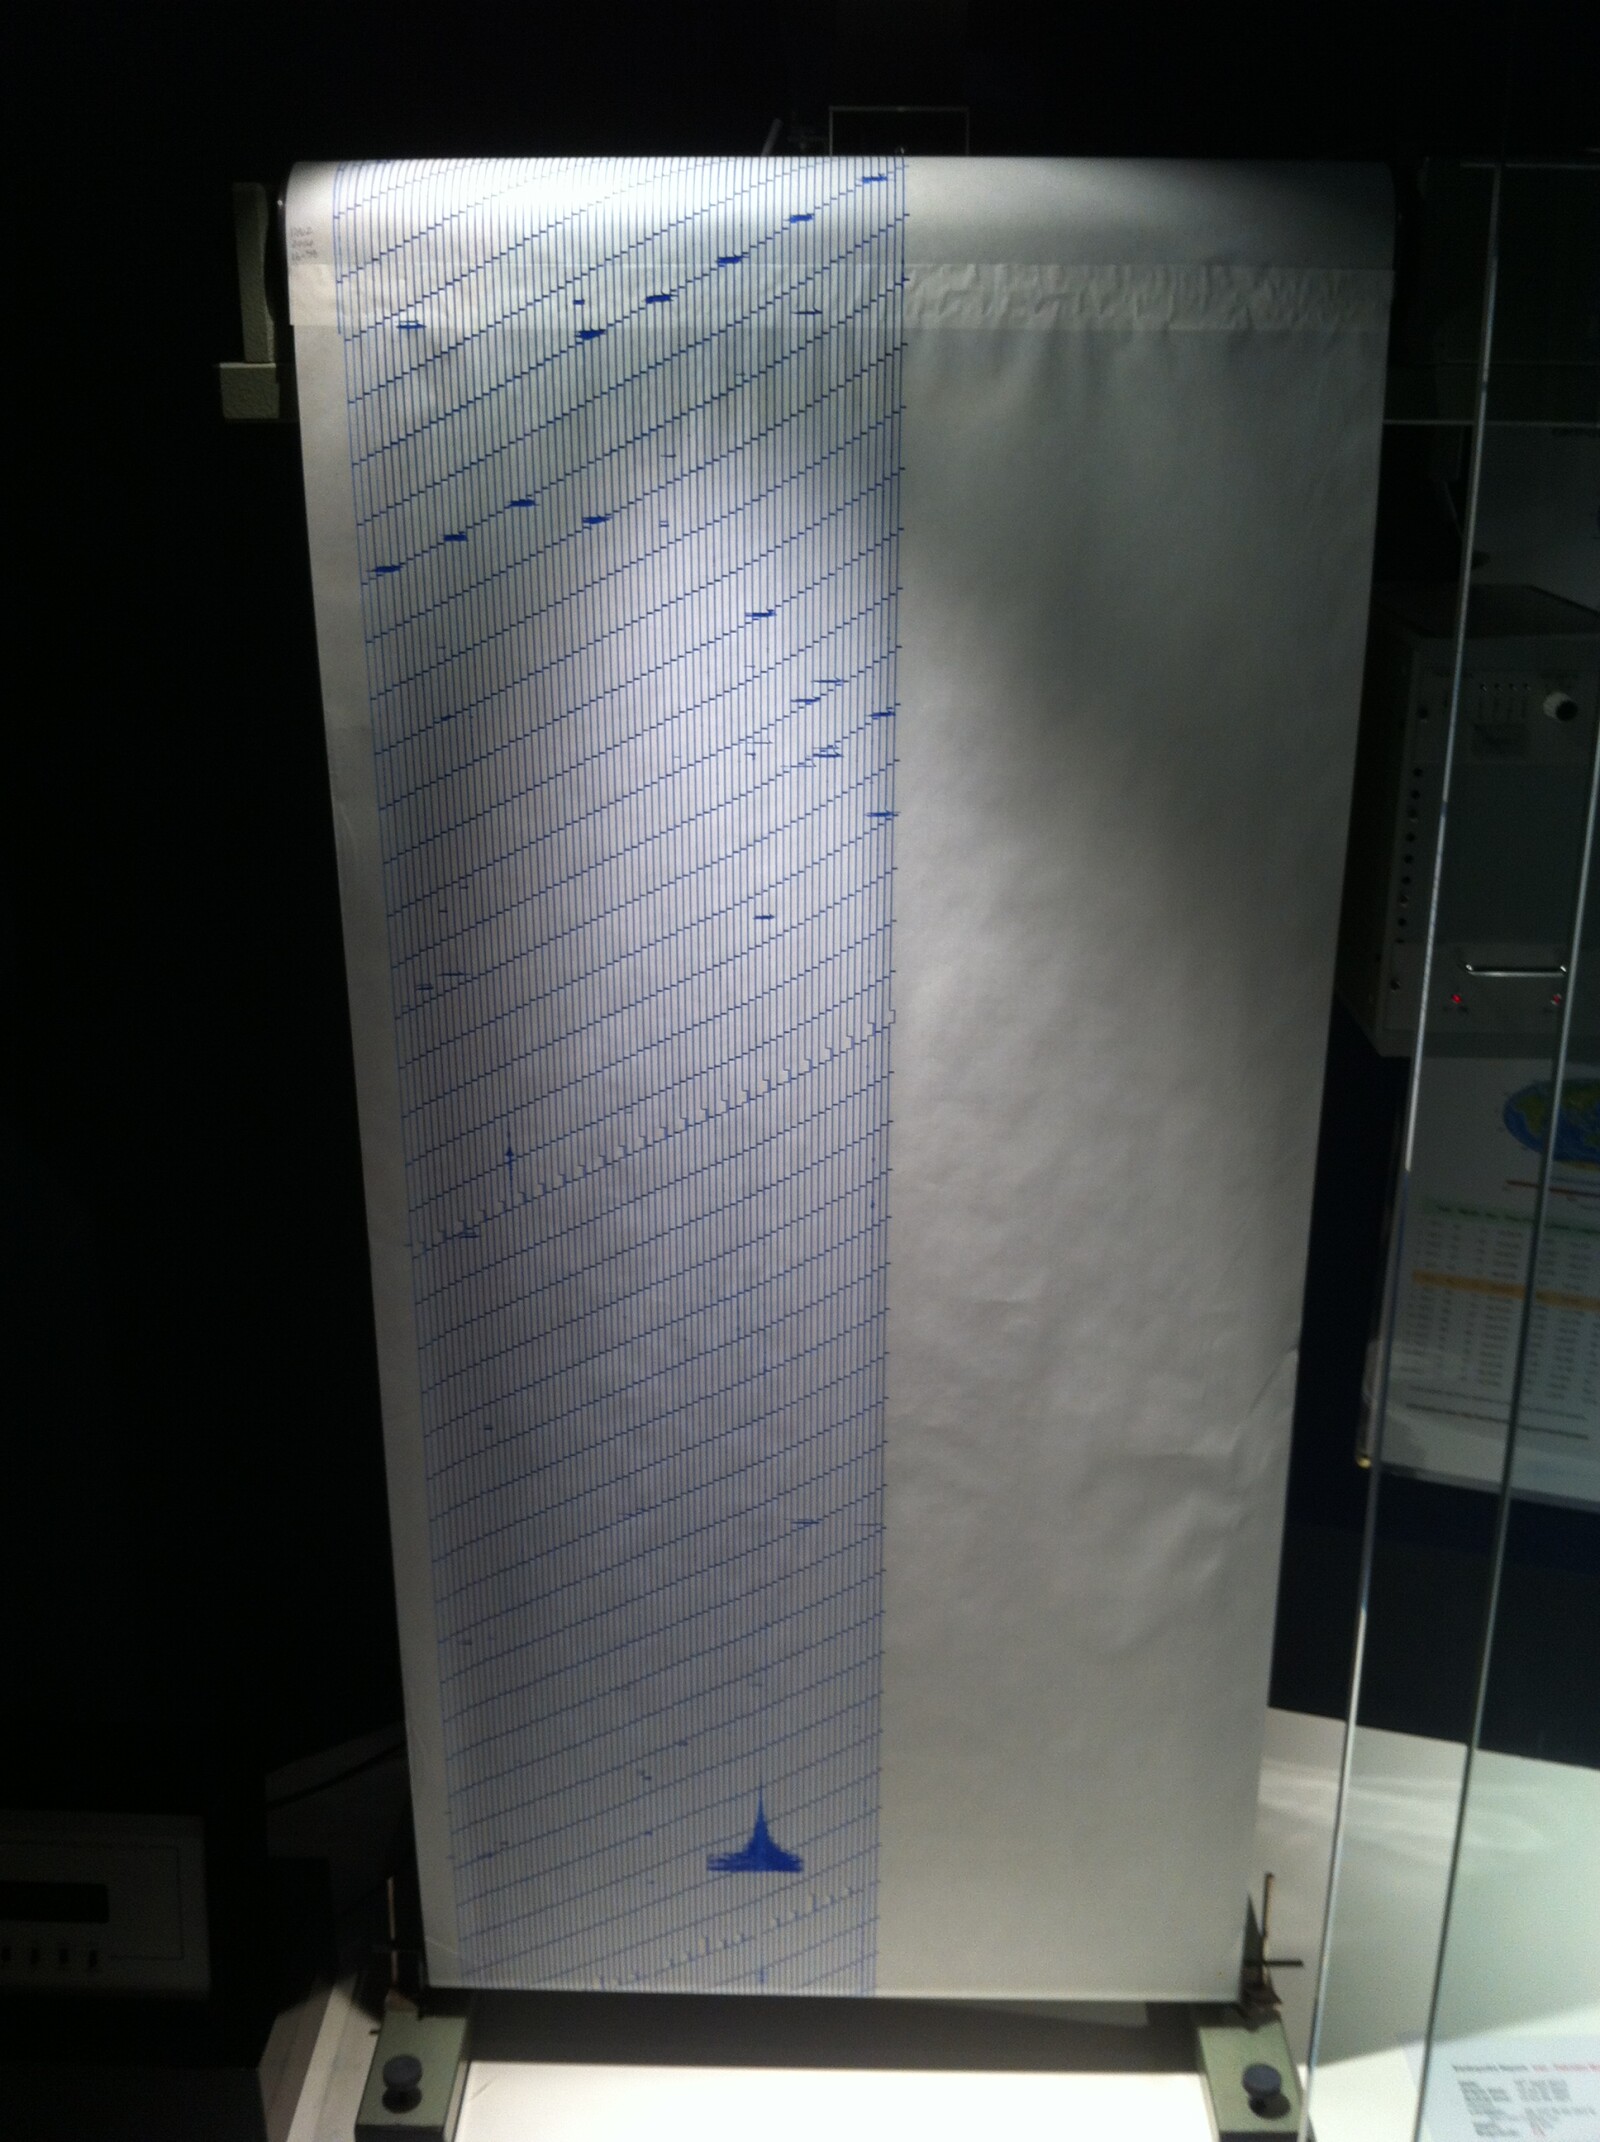
The British Geological Survey (BGS) reported a 4.1 magnitude earthquake in the Bristol Channel at 13:21 GMT on 20th February 2014. The event was also recorded on the Museum seismograph in the Evolution of Wales Gallery at National Museum Cardiff.

This is the largest earthquake in the UK since the 5.2 magnitude Market Rasen quake in February 2008.

The earthquake was felt widely across South Wales, Devon, Somerset and western Gloucestershire. Reports to the BGS described “felt like the vibration of a large vehicle passing the building”, “the whole house seemed to move/wobble back and forth a few times”.

The earthquake epicentre is estimated to be 18 km NNW of Ilfracombe at a depth of 3km.

Although the UK is not located on a plate margin, on average 200 – 300 earthquakes a year are recorded in Britain. Most earthquakes are so small they are not felt by people, and can only be picked up by the sensitivity of a seismometer.

The UK is located on the European plate. Tension is built up in the plate as new crust is created at the Mid Atlantic Ridge, and the plate is slowly pushed towards the north-east.

There are several long-active faults in the Bristol Channel which include the Bristol Channel – Bray fault. Once faults form, they create weak zones in the crust that can be reactivated time and time again. Movement occurred along one of these faults as tension in the crust was released.

On average an earthquakes of this size affects mainland Britain once every 2 years.

The largest recorded mainland event is the magnitude 5.4 earthquake on the Lleyn Peninsula in July 1984, where movement occurred along a long-active pre-existing fault.


The Participatory Forums

Penny Dacey, 25 February 2014

The Informal Learning Forum

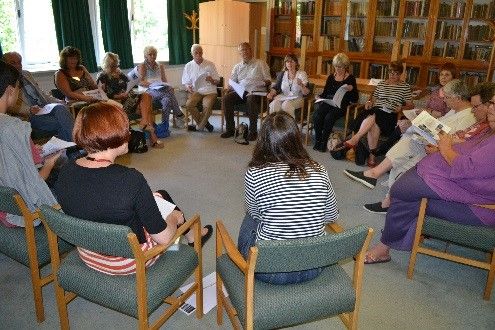
Informal Learning in this context refers to learning outside of the school curriculum. The group consists of representatives from organizations across Wales that facilitate adult and family learning. Most members had previous knowledge of the project having participated in workshops during the planning stage. This group have agreed a remit of work which includes; helping to develop a programme of activities that appeals to people of varied background and ability and reviewing gallery content to ensure we provide appropriate interpretive methods for these audiences.

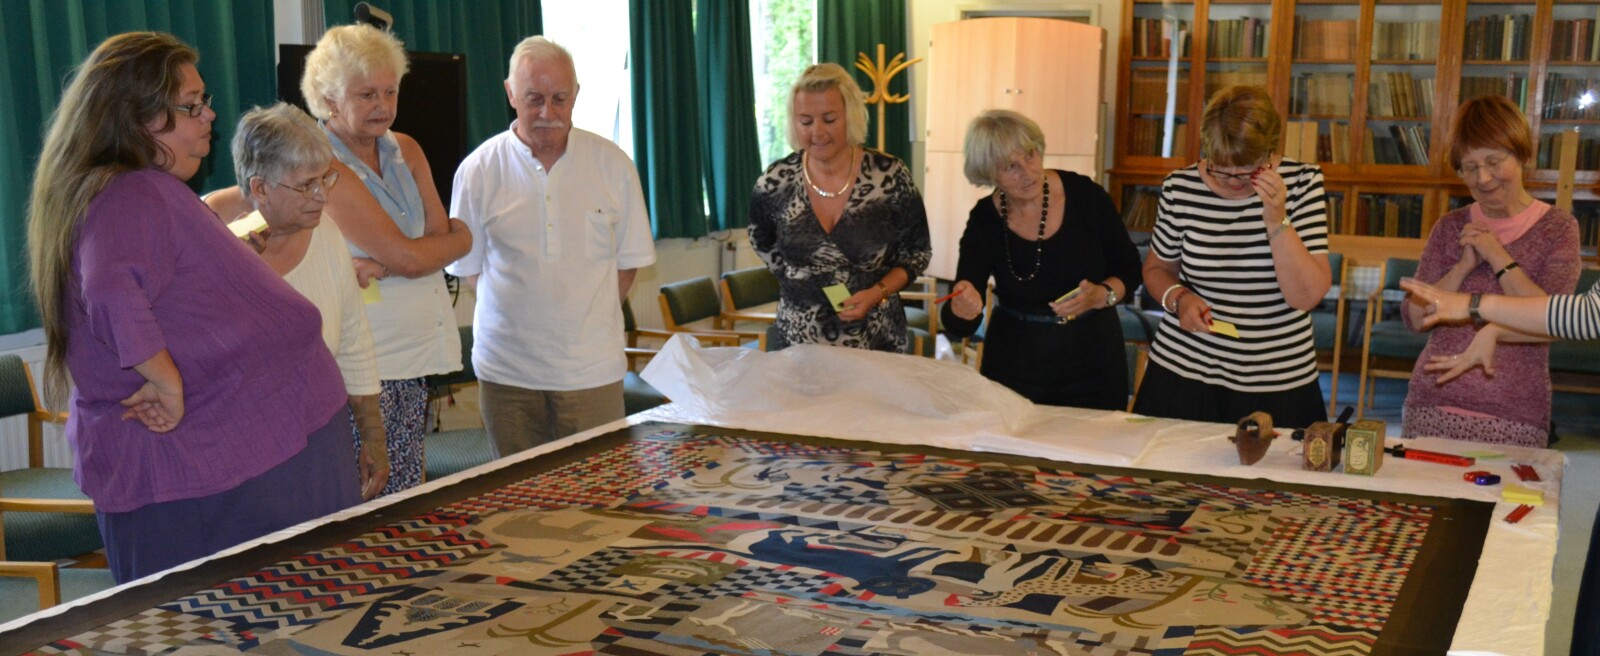
As a result of this Forum a group of adult learners from the Workers Educational Association (WEA) participated in interpretation workshops in July. The workshops provided an opportunity for the group to give their views on items intended for the ‘Wales is’ gallery. Objects studied at close hand included a tailors quilt and artefacts dating from the First World War. The sessions were facilitated by curators working directly with the objects – ensuring that the feedback gleaned has a direct impact on their work.

Rain, rain and more rain

Catalena Angele, 21 February 2014

What a very wet and rainy January we had bulb buddies! It felt like it rained nearly every day! But how much rain did we really have compared to average?

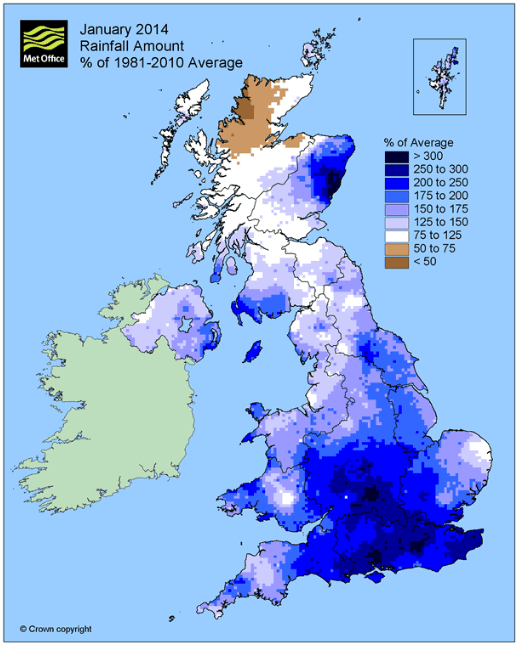
Weather Scientists at the Met Office have created this map of the U.K. to show how much rain we had in January. You can have a closer look by following this link.

How did they calculate average rainfall? The Met Office Scientists have been keeping weather records for a very long time! They added up how much rain fell in January for 30 years (from 1981 to 2010) then divided by 30 to calculate how much rain fell on average each year.

Can you see the two different shades of dark blue? Rainfall in these areas was between two and three times the average for January. Can you see the black areas in the south of England and in eastern Scotland? Rainfall in these areas was more than three times the average for January!

Top tip for using this map:

  • 100% of average means that the rain was the same as average.
  • 200% of average means that there was twice as much rain as average.

Can you find where you live on the map? What colour is the map where you live? How much rain fell in your area? Is it more than average? Or less than average? You may want to ask your teacher to help you answer these questions!

Your questions, my answers:

Gladestry C.I.W. School: Our school was closed on Thursday because of a power cut so our head teacher recorded the results that day. Prof P: We done to your head teacher! I am very glad your head teacher is helping you with your investigation.

St Mellons Church in Wales Primary School: Hello Professor Plant. It has been so windy this week that our thermometer has blown off the wall and broken. We have been using the car thermometer. L, J and L-b. Prof P: Hello L, J and L-b at St Mellons School! I am very sorry to hear that your thermometer is broken, I will email your teacher and arrange to send you a new one. Well done for your quick thinking in using the car thermometer.

Bleasdale CE Primary School: It is very cold and wet. Prof P: I agree BleasdaleSchool!

Ysgol Gynradd Dolgellau: Yn anffodus mae ein thermometr wedi torri ar ol cael ei chwythu gan y gwynt mawr yn ystod yr wythnos. Athro’r Ardd: Trueni mawr i glywed hyn Ysgol Gynradd Dolgellau. Bydda i’n e-bostio eich athro i drefnu anfon thermomedr newydd atoch chi.

Manor Road Primary School (Lancashire): on Wednesday there was a red weather warning but luckily the plants stayed in place. Prof P: I’m very happy to hear that your plants are okay!

Stanford in the Vale Primary School: It is very rainy here but we are not flooded. Prof P: I am very glad to hear that Stanford! What colour is the rainfall map is your area?

Burscough Bridge Methodist School: The heavy gales have caused the rainfall measurements to be unreadable as the measuring vessel was continually disrupted and blown over. Prof P: Gosh it must have been very stormy. Thanks for letting me know, keep up the good work!

Many Thanks

Professor Plant

Exploring Insect Diversity in Thailand

Katie Mortimer-Jones, 17 February 2014

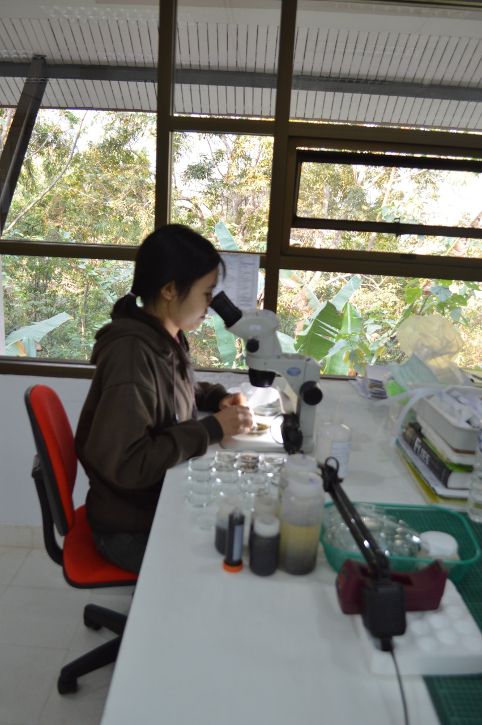
Work continues in a joint project with colleagues at the Entomology Section of the Queen Sirikit Botanic Garden (QSBGE) in Thailand exploring the diversity of tropical Diptera (flies). The objectives are to learn more about why two mountains in northern Thailand are such hotspots of diversity (the number and variety of species) and why so many endemic species are found there (an endemic species is one entirely confined to a particular locality). We should also learn much about the ecology of different communities of insects living in different forest types occurring at different altitudes. The project was started last January with Malaise traps (a tent-like structure into which insects fly and can be trapped) being set up along an altitude transect on Thailand’s highest mountain Doi Inthanon, and in the summit forests of slightly lower Doi Phahompok. Wichai Srisuka and his staff from QSBGE will empty the contents of the traps every two weeks for a full year and their team of expert technicians will conduct initial sorting and identifications at their laboratories and collection centre not far from the city of Chiang Mai. Some of the initial collections have already been made and many potentially very interesting specimens have been collected. The first consignment of material will be arriving in Cardiff shortly where I will begin the detailed taxonomic work; identifying species that have already been described, and, the more exciting part of recognizing and describing the many completely new species that will undoubtedly be found. I hope to feature some of the new species found in this blog later this year as the work progresses.

Introduction to the project

Dr Adrian Plant